• Posted by Konstantin 02.01.2024 No Comments

    This article has been cross-posted to Hackster.

    What is the best way to learn (or teach) introductory robotics? What could be the "hello world" project in this field, that would be simple for a beginner to get started with, complex enough to be exciting and qualify as a "robot", and deep enough to allow further creative extensions and experiments? Let us try solving this problem logically, step by step!

    First things first: what is a "robot"?

    Axiom number one: for anything to feel like a robot, it must have some moving parts. Ideally, it could have the freedom move around, and probably the easiest way to achieve that would be to equip it with two wheels. Could concepts other than a two-wheeler qualify as the simplest robot? Perhaps, but let us proceed with this one as a reasonably justified assumption.

    The wheels

    To drive the two upcoming wheels we will need two motors along with all that driver circuitry, ugh! But wait, what about those small continuous rotation servos! They are simple, cheap, and you just need to wire them to a single microcontroller pin. Some of them are even conveniently sold along with with a LEGO-style wheel!

    The microcontroller

    Rule number two: it is not a real robot, unless it has a programmable brain, like a microcontroller. But which microcontroller is the best for a beginner in year 2024? Some fifteen years ago the answer would certainly have the "Arduino" keyword in it. Nowadays, I'd say, the magic keyword is "CircuitPython". Programming just cannot get any simpler than plugging it into your computer and editing code.py on the newly appeared external drive. No need for "compiling", "flashing" or any of the "install these serial port drivers to fix obscure error messages" user experiences (especially valuable if you need to give a workshop at a school computer class). Moreover, the code to control a wheel looks as straightforward as motor.throttle = 0.5.

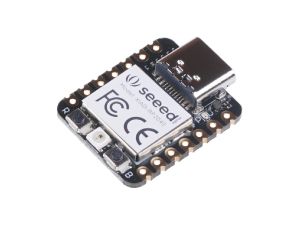
    OK, CircuitPython it is, but what specific CircuitPython-compatible microcontroller should we choose? We need something cheap and well-supported by the manufacturer and the community. The Raspberry Pi Pico would be a great match due to its popularity, price and feature set, except it is a bit too bulky (as will become clear below). Check out the Seeedstudio Xiao Series instead. The Xiao RP2040 is built upon the same chip as the Raspberry Pi Pico, is just as cheap, but has a more compact size. Interestingly, as there is a whole series of pin-compatible boards with the same shape, we can later try other models if we do not like this one. Moreover, we are not even locked into a single vendor, as the QT Py series from Adafruit is also sharing the same form factor. How cool is that? (I secretly hope this particular footprint would get more adoption by other manufacturers).

    The body

    OK, cool. We have our wheels and a microcontroller to steer them. We now need to build the body for our robot and wire things together somehow. What would be the simplest way to achieve that?

    Let us start with the wiring, as here we know an obviously correct answer - a breadboard. No simpler manual wiring technology has been invented so far, right? Which breadboard model and shape should we pick? This will depend on how we decide to build the frame for our robot, so let us put this question aside for a moment.

    How do we build the frame? The options seem infinite: we can design it in a CAD tool and laser cut it from acrylic sheets, print on a 3D printer, use some profile rails, wooden blocks, LEGO bricks,... just ask Google for some inspiration:

    Ugh, this starts to feel too complicated and possibly inaccessible to a normal schoolkid.... But wait, what is it there on the back of our breadboard? Is it sticky tape? Could we just... stick... our motors to it directly and use the breadboard itself as the frame?

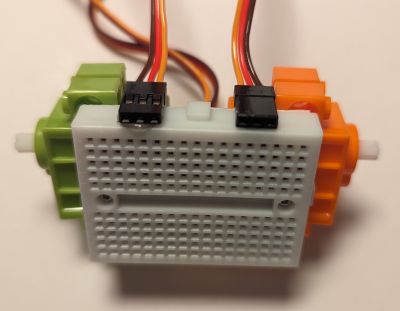
    If we now try out a few breadboard models, we will quickly discover that the widespread, "mini-sized", 170-pin breadboard has the perfect size to host our two servos:

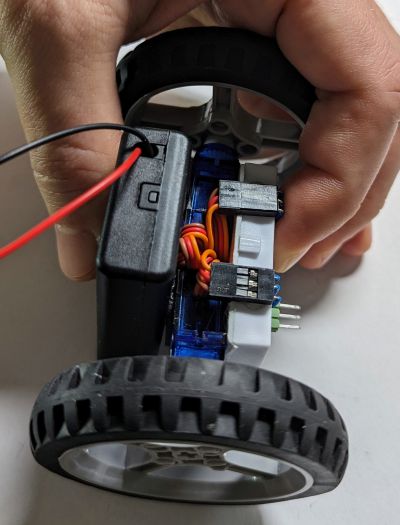
    By an extra lucky coincindence, the breadboard even has screw holes in the right places to properly attach the motors! If we now hot glue the servo connectors to the side as shown above, we can wire them comfortably, just as any other components on the breadboard itself. Finally, there is just enough space in the back to pack all the servo wires and stick a 3xAAA battery box, which happens to be enough to power both our servos and the Xiao RP2040:

    This picture shows the FS90R servos. These work just as well as the GeekServo ones shown in in the picture above.

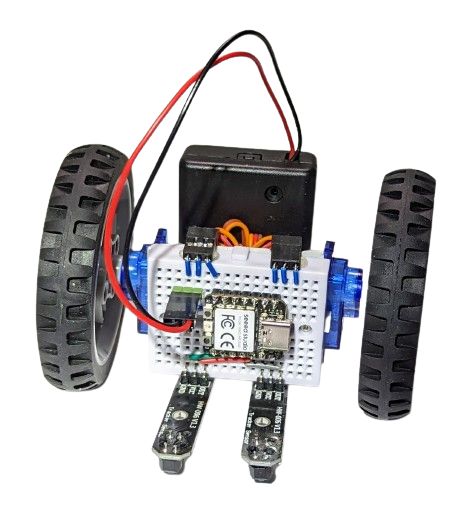
    ... and thus, the BreadboardBot is born! Could a breadboard with two motors and a battery stuck to its back qualify as the simplest, lowest-tech ever robot platform? I think it could. Note that the total cost of this whole build, including the microcontroller is under $20 (under $15 if you order at the right discounts from the right places).

    But what can it do?

    Line following

    Rule number 3: it is not a real robot if it is not able to sense the environment and react to it somehow. Hence, we need some sensors, preferably ones that would help us steer the robot (wheels are our only "actuators" so far). What are the simplest steering techniques in introductory robotics? I'd say line following and obstacle avoidance!

    Let us do line following first then. Oh, but how do we attach the line tracking sensors, we should have built some complicated frame after all, right? Nope, by a yet another happy design coincidence, we can just plug them right here into our breadboard:

    Thanks to the magic of CircuitPython, all it takes now to teach our robot to (even if crudely) follow a line is just three lines of code (boilerplate definitions excluded):

    while True:
      servo_left.throttle = 0.1 * line_left.value
      servo_right.throttle = -0.1 * line_right.value

    Obstacle avoidance

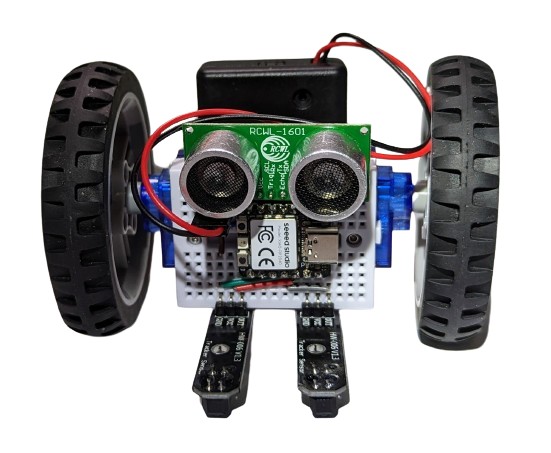
    OK, a line follower implemented with a three-line algorithm is cool, can we do anything else? Sure, look how conveniently the ultrasonic distance sensor fits onto our breadboard:

    Add a few more lines of uncomplicated Python code and you get a shy robot that can follow a line but will also happily go roaming around your room, steering away from any walls or obstacles:

    Note how you can hear the sonar working in the video (not normally audible).

    ... and more

    There is still enough space on the breadboard to add a button and a buzzer:

    .. or splash some color with a Xiao RGB matrix:

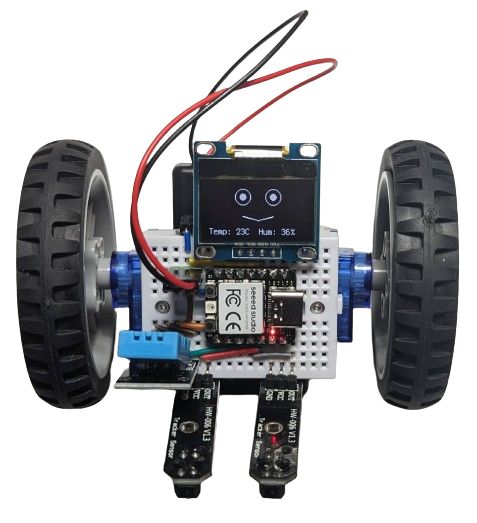
    .. or plug in an OLED screen to give your BreadboardBot a funny animated face:
    The one on the image above also had the DHT11 sensor plugged into it, so it shows humidity and temperature while it is doing its line following. Why? Because it can!

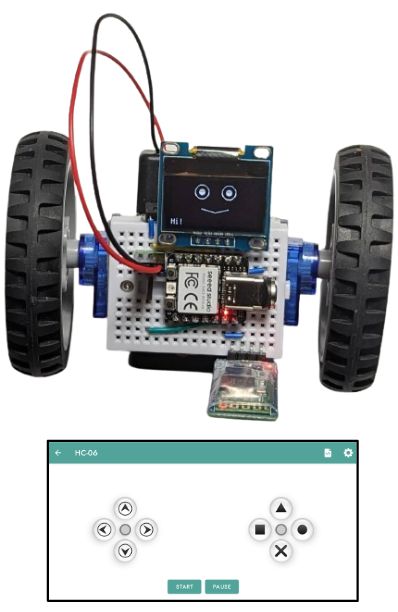
    Tired of programming and just want a remote-controllable toy? Sure, plug in a HC06 bluetooth serial module, program one last time, and go steer the robot yourself with a smartphone:

    Other microcontroller boards, BLE, Wifi and FPV

    Xiao RP2040 is great, but it has no built-in wireless connectivity! Plug in its ESP32-based cousin Xiao ESP32S3 and you can steer your robot with a Bluetooth gamepad, or via Wifi, by opening a webpage served by the robot itself!
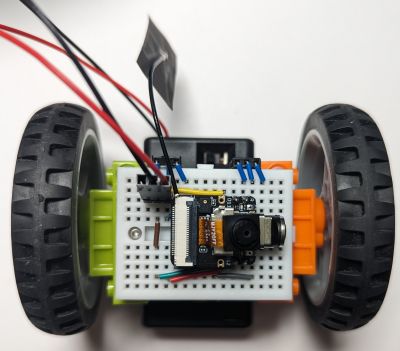
    If you have the Xiao ESP32S3 Sense (the version with a microphone and camera), that webpage can even show you the live first-person view feed of the robot's camera (conveniently positioned to look forward):

    In case you were wondering, the resulting FPV bot is not a very practical solution for spying on your friends, as the microcontroller heats up a lot and consumes the battery way too fast, but it is still a fun toy and an educational project.

    Finally, although the Xiao boards fit quite well with all other gadgets on the mini breadboard you are not limited by that choice either and can try plugging in any other appropriately-sized microcontroller board. Here is, for example, a BreadboardBot with an M5Stack Atom Lite running a line-follower program implemented as an ESPHome config (which you can flash over the air!).


    Conclusion

    The examples above are just the tip of the iceberg. Have any other sensors lying around from those "getting started with Arduino" kits that you did not find sufficiently exciting uses for so far? Maybe plugging them into the BreadboardBot is the chance to shine they were waiting for all this time! Teaching the robot to recognize familiar faces and follow them? Solving a maze? Following voice commands? Self-balancing? Programming coordinated movement of multiple robots? Interfacing the robot with your smart home or one of these fancy AI chatbots? Organizing competitions among multiple BreadboardBots? Vacuuming your desk? The sky (and your free time) is the limit here!

    Consider making one and spreading the joy of breadboard robotics!

    Detailed build instructions along with wiring diagrams and example code are available on the project's Github page. Contributions are warmly welcome!

    Tags: , , , , , , ,

  • Posted by Konstantin 21.10.2019 No Comments

    Can't help sharing this lovely example, illustrating the way Python interns small integers, the lower level use of the id function as well as the power of the ctypes module.

    import ctypes
    def deref(addr, type_):
        return ctypes.cast(addr, ctypes.POINTER(type_))
    
    deref(id(29), ctypes.c_int)[4] = 100
    > 29
    100
    
    > 29*100
    10000
    
    > 25+4
    100

    Note that depending on the version of Python the value of the integer may be stored at either offset [4] or [6].

    Tags: , , , ,

  • Posted by Konstantin 11.02.2019 2 Comments

    Presentation ClipartPresenting is hard. Although I have had the opportunity to give hundreds of talks and lectures on various topics and occasions by now, preparing every new presentation still takes me a considerable amount of effort. I have had a fair share of positive feedback, though, and have developed a small set of principles which, I believe, are key to preparing (or at least learning to prepare) good presentations. Let me share them with you.

    1. Start off without slides

    Plan your talk as if you had to give it using only a blackboard. Think about what to say and how to say it so that the listener would be interested to look at you and listen to you. You will then discover moments in your speech, where you need to write or draw something on the blackboard. These will be your slides. Remember, that your slides are only there to enhance and illustrate your presentation. Your speech is its main component.

    Of course, preparing slides can be a very convenient way to plan your talk, but try not to fall into the popular trap, where your slides end up being the talk, whilst your own role boils down to basically "playing them back" in front of the audience, so that one may start wondering why are you even there.

    When you are done with your slides, a useful practice is to go over them and remove all of the text, besides the parts which you would really have to scribble on the blackboard, if the slides were not available. For any piece of text you currently have on the slide, ask yourself, what is its purpose. Usually there are just two possible answers:

    1. It is there to help the listener. In this case, what you usually need instead is an illustration. An actual chart, photo or a schematic cartoon, providing the listener with a useful visual aid. Yes, plain text can also be a visual aid sometimes, but it should be your last resort.
    2. Alternatively, you put it there only to help yourself - as a reminder of what to speak about next or what specific wording to use. Delete such texts completely and put some effort into memorizing the talk instead. You can make a paper cheatsheet to peek at during the trickier spots. In general, however, if you find it hard to navigate or memorize your talk, perhaps you should have organized it better in the first place. Which leads us to the second rule:

    2. Structure around questions

    Imagine that you are constrained to explain your point by only asking questions to the audience. The audience would effectively have to present the topic "by themselves" by answering these questions in order. Surprisingly many seemingly complicated topics may be explained in that manner. Of course, you do not need to literally perform the talk by only querying the audience (although I would suggest you try this format at least once - it can be rather fun). The idea is that the imaginary order of questions that need to be asked, is the best order of exposition for your topic. It is this precise order, in which most new statements tend to follow logically from the previous ones not just for you, but also for the audience, who will thus find it easier to track your talk.

    3. Presenting is show business

    Remember that every presentation is a show. Your goal is not to explain something in the most precise manner, but to do it in the most interesting manner. There is a caveat, of course: the notion of "interestingness" depends on your audience. Presentations made for schoolkids, students, professors and grandmothers differ not because they need to be told different things, but because you need to tell them the same things in different ways. Thus, always tailor your talk to the audience.

    One basic rule which fits most audiences, though, is the following: if you may include interactivity in your talk (i.e. if the format and formalities allow for that), do so. The most basic element of interactivity in a typical presentation would be a question to the audience. There are two main kinds of questions:

    1. "Leading questions", where you ask the audience to explain the concepts on their own (see part 2 above).
    2. "Quiz questions", for checking whether the listener is still on board. This can provide you with real-time feedback and let you know when you need to slow down or speed up.

    Smart combination of these two kinds of interactions would nearly always bump the interestingness of your talk up a notch. It is not enough to know what and when to ask, however. The choice of who to direct your questions to is just as important. Try to avoid the widely spread practice of simply throwing questions into the audience "in general" and giving word to whoever jumps up first. This would often engage just the few most extraverted or excited listeners, leaving the rest feeling a bit like outsiders (although semi-anonymous surveys can be fun sometimes). Unfortunately, communicating with the audience is an art which requires a lot of practice and failed attempts to master. While you are not there yet, let me suggest one simple recipe, which I found to be unexpectedly useful for student audiences - the talking pillow game. Pick an object (not necessarily a pillow) and give it to a random listener. That listener now has to answer your next question and pass the object on to their neighbor.

    Of course, asking questions is just the most basic way of introducing useful interaction. Some concepts can be explained in the format of an interactive demo. Try devising one, whenever you can. Keep your listeners awake at all costs.

    4. Experiment a lot

    Remember that every presentation is a chance to try something new. Feel free to experiment with the various styles and formats every time (this is especially true while you are a student and "failing" a yet-another seminar talk is not really a big deal). Try practicing blackboard-only talks. Do a talk where you only ask questions. Try making a talk where you have no text on the slides at all. Make your talk into an interactive workshop. Experiment with the slide types and formats. Try sitting/standing/walking during the talk. Dance and sing (if you're up to). Trying is the only way to figure out what works and what does not work for you.  In any case, carefully rehearse all the elements of your talk which do not yet come naturally. For the first 100 times this would mean rehearsing all of the talk.

    5. Film yourself

    Always ask someone to film your presentation. Watching yourself is the only way to discover that you are holding your hands strangely, not looking into the audience, swinging back and forth, closing your eyes, and so on. Watching yourself is often a painfully embarrassing, but a pretty much mandatory procedure, if you want to get better.


    Tags: ,

  • Posted by Konstantin 29.11.2018 4 Comments

    By popular suggestion this text was cross-posted to Medium.

    Suppose you are starting a new data science project (which could either be a short analysis of one dataset, or a complex multi-year collaboration). How should your organize your workflow? Where do you put your data and code? What tools do you use and why? In general, what should you think about before diving head first into your data? In the software engineering industry such questions have some commonly known answers. Although every software company might have its unique traits and quirks, the core processes in most of them are based on the same established principles, practices and tools. These principles are described in textbooks and taught in universities.

    Data science is a less mature industry, and things are different. Although you can find a variety of template projects, articles, blogpostsdiscussions, or specialized platforms (open-source [1,2,3,4,5,6,7,8,9,10], commercial [11,12,13,14,15,16,17] and in-house [18,19,20]) to help you organize various parts of your workflow, there is no textbook yet to provide universally accepted answers. Every data scientist eventually develops their personal preferences, mostly learned from experience and mistakes. I am no exception. Over time I have developed my understanding of what is a typical "data science project", how it should be structured, what tools to use, and what should be taken into account. I would like to share my vision in this post.

    The workflow

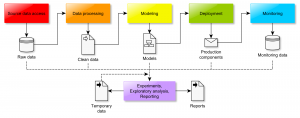
    Although data science projects can range widely in terms of their aims, scale, and technologies used, at a certain level of abstraction most of them could be implemented as the following workflow:

    Data science project workflow

    Colored boxes denote the key processes while icons are the respective inputs and outputs. Depending on the project, the focus may be on one process or another. Some of them may be rather complex while others trivial or missing. For example, scientific data analysis projects would often lack the "Deployment" and "Monitoring" components. Let us now consider each step one by one.

    Source data access

    Whether you are working on the human genome or playing with iris.csv, you typically have some notion of "raw source data" you start your project with. It may be a directory of *.csv files, a table in an SQL server or a HDFS cluster. The data may be fixed, constantly changing, automatically generated or streamed. It could be stored locally or in the cloud. In any case, your first step is to define access to the source data. Here are some examples of how this may look like:

    • Your source data is provided as a set of *.csv files. You follow the cookiecutter-data-science approach, make a data/raw subdirectory in your project's root folder, and put all the files there. You create the docs/data.rst file, where you describe the meaning of your source data. (Note: Cookiecutter-DataScience template actually recommends references/ as the place for data dictionaries, while I pesonally prefer docs. Not that it matters much).
    • Your source data is provided as a set of *.csv files. You set up an SQL server, create a schema named raw and import all your CSV files as separate tables. You create the docs/data.rst file, where you describe the meaning of your source data as well as the location and access procedures for the SQL server.
    • Your source data is a messy collection of genome sequence files, patient records, Excel files and Word documents, which may later grow in unpredicted ways. In addition, you know that you will need to query several external websites to receive extra information. You create an SQL database server in the cloud and import most of the tables from Excel files there. You create the data/raw directory in your project, put all the huge genome sequence files into the dna subdirectory. Some of the Excel files were too dirty to be imported into a database table, so you store them in data/raw/unprocessed directory along with the Word files. You create an Amazon S3 bucket and push your whole data/raw directory there using DVC. You create a Python package for querying the external websites. You create the docs/data.rst file, where you specify the location of the SQL server, the S3 bucket, the external websites, describe how to use DVC to download the data from S3 and the Python package to query the websites. You also describe, to the best of your understanding, the meaning and contents of all the Excel and Word files as well as the procedures to be taken when new data is added.
    • Your source data consists of constantly updated website logs. You set up the ELK stack and configure the website to stream all the new logs there. You create docs/data.rst, where you describe the contents of the log records as well as the information needed to access and configure the ELK stack.
    • Your source data consists of 100'000 colored images of size 128x128. You put all the images together into a single tensor of size 100'000 x 128 x 128 x 3 and save it in an HDF5 file images.h5. You create a Quilt data package and push it to your private Quilt repository. You create the docs/data.rst file, where you describe that in order to use the data it must first be pulled into the workspace via quilt install mypkg/images and then imported in code via from quilt.data.mypkg import images.
    • Your source data is a simulated dataset. You implement the dataset generation as a Python class and document its use in a README.txt file.

    In general, remember the following rules of thumb when setting up the source data:

    1. Whenever you can meaningfully store your source data in a conveniently queryable/indexable form (an SQL database, the ELK stack, an HDF5 file or a raster database), you should do it. Even if your source data is a single csv and you are reluctant to set up a server, do yourself a favor and import it into an SQLite file, for example. If your data is nice and clean, it can be as simple as:
      import sqlalchemy as sa
      import pandas as pd
      e = sa.create_engine("sqlite:///raw_data.sqlite")
      pd.read_csv("raw_data.csv").to_sql("raw_data", e)
    2. If you work in a team, make sure the data is easy to share. Use an NFS partition, an S3 bucket, a Git-LFS repository, a Quilt package, etc.
    3. Make sure your source data is always read-only and you have a backup copy.
    4. Take your time to document the meaning of all of your data as well as its location and access procedures.
    5. In general, take this step very seriously. Any mistake you make here, be it an invalid source file, a misunderstood feature name, or a misconfigured server may waste you a lot of time and effort down the road.

    Data processing

    The aim of the data processing step is to turn the source data into a "clean" form, suitable for use in the following modeling stage. This "clean" form is, in most cases, a table of features, hence the gist of "data processing" often boils down to various forms of feature engineering. The core requirements here are to ensure that the feature engineering logic is maintainable, the target datasets are reproducible and, sometimes, that the whole pipeline is traceable to the source representations (otherwise you would not be able to deploy the model). All these requirements can be satisfied, if the processing is organized in an explicitly described computation graph. There are different possibilities for implementing this graph, however. Here are some examples:

    • You follow the cookiecutter-data-science route and use Makefiles to describe the computation graph. Each step is implemented in a script, which takes some data file as input and produces a new data file as output, which you store in the data/interim or data/processed subdirectories of your project. You enjoy easy parallel computation via make -j <njobs>.
    • You rely on DVC rather than Makefiles to describe and execute the computation graph. The overall procedure is largely similar to the solution above, but you get some extra convenience features, such as easy sharing of the resulting files.
    • You use LuigiAirflow or any other dedicated workflow management system instead of Makefiles to describe and execute the computation graph. Among other things this would typically let you observe the progress of your computations on a fancy web-based dashboard, integrate with a computing cluster's job queue, or provide some other tool-specific benefits.
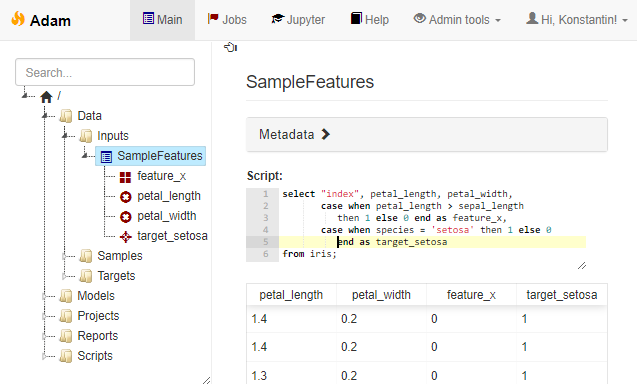
    • All of your source data is stored in an SQL database as a set of tables. You implement all of the feature extraction logic in terms of SQL views. In addition, you use SQL views to describe the samples of objects. You can then use these feature- and sample-views to create the final modeling datasets using auto-generated queries like
      select
         s.Key
         v1.AverageTimeSpent,
         v1.NumberOfClicks,
         v2.Country
         v3.Purchase as Target
      from vw_TrainSample s
      left join vw_BehaviourFeatures v1 on v1.Key = s.Key
      left join vw_ProfileFeatures v2 on v2.Key = s.Key
      left join vw_TargetFeatures v3 on v3.Key = s.Key

      This particular approach is extremely versatile, so let me expand on it a bit. Firstly, it lets you keep track of all the currently defined features easily without having to store them in huge data tables - the feature definitions are only kept as code until you actually query them. Secondly, the deployment of models to production becomes rather straightforward - assuming the live database uses the same schema, you only need to copy the respective views. Moreover, you may even compile all the feature definitions into a single query along with the final model prediction computation using a sequence of CTE statements:

      with _BehaviourFeatures as (
       ... inline the view definition ...
      ),
      _ProfileFeatures as (
       ... inline the view definition ...
      ),
      _ModelInputs as (
       ... concatenate the feature columns ...
      )
      select
           Key,
           1/(1.0 + exp(-1.2 + 2.1*Feature1 - 0.2*Feature3)) as Prob
      from _ModelInputs

      This technique has been implemented in one in-house data science workbench tool of my design (not publicly available so far, unfortunately) and provides a very streamlined workflow.

      Example of an SQL-based feature engineering pipeline

      Example of an SQL-based feature engineering pipeline

    No matter which way you choose, keep these points in mind:

    1. Always organize the processing in the form of a computation graph and keep reproducibility in mind.
    2. This is the place where you have to think about the compute infrastructure you may need. Do you plan to run long computations? Do you need to parallelize or rent a cluster? Would you benefit from a job queue with a management UI for tracking task execution?
    3. If you plan to deploy the models into production later on, make sure your system will support this use case out of the box. For example, if you are developing a model to be included in a Java Android app, yet you prefer to do your data science in Python, one possibility for avoiding a lot of hassle down the road would be to express all of your data processing in a specially designed DSL rather than free-from Python. This DSL may then be translated into Java or an intermediate format like PMML.
    4. Consider storing some metadata about your designed features or interim computations. This does not have to be complicated - you can save each feature column to a separate file, for example, or use Python function annotations to annotate each feature-generating function with a list of its outputs. If your project is long and involves several people designing features, having such a registry may end up quite useful.

    Modeling

    Once you have done cleaning your data, selecting appropriate samples and engineering useful features, you enter the realm of modeling. In some projects all of the modeling boils down to a single m.fit(X,y) command or a click of a button. In others it may involve weeks of iterations and experiments. Often you would start with modeling way back in the "feature engineering" stage, when you decide that outputs of one model make for great features themselves, so the actual boundary between this step and the previous one is vague. Both steps should be reproducible and must make part of your computation graph. Both revolve around computing, sometimes involving job queues or clusters. None the less, it still makes sense to consider the modeling step separately, because it tends to have a special need: experiment management. As before, let me explain what I mean by example.

    • You are training models for classifying Irises in the iris.csv dataset. You need to try out ten or so standard sklearn models, applying each with a number of different parameter values and testing different subsets of your handcrafted features. You do not have a proper computation graph or computing infrastructure set up - you just work in a single Jupyter notebook. You make sure, however, that the results of all training runs are saved in separate pickle files, which you can later analyze to select the best model.
    • You are designing a neural-network-based model for image classification. You use ModelDB (or an alternative experiment management tool, such as TensorBoard, Sacred, FGLab, Hyperdash, FloydHub, Comet.ML, DatMo, MLFlow, ...) to record the learning curves and the results of all the experiments in order to choose the best one later on.
    • You implement your whole pipeline using Makefiles (or DVC, or a workflow engine). Model training is just one of the steps in the computation graph, which outputs a model-<id>.pkl file, appends the model final AUC score to a CSV file and creates a model-<id>.html report, with a bunch of useful model performance charts for later evaluation.
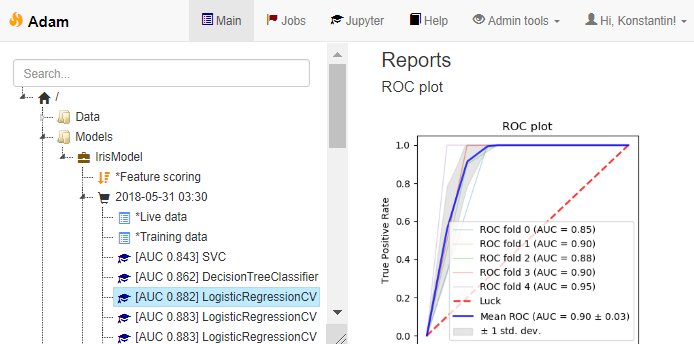
    • This is how experiment management / model versioning looks in the UI of the custom workbench mentioned above:

      Experiment management

      Experiment management

    The takeaway message: decide on how you plan to manage fitting multiple models with different hyperparameters and then selecting the best result. You do not have to rely on complex tools - sometimes even a manually updated Excel sheet works well, when used consistently. If you plan lengthy neural network trainings, however, do consider using a web-based dashboard. All the cool kids do it.

    Model deployment

    Unless your project is purely exploratory, chances are you will need to deploy your final model to production. Depending on the circumstances this can turn out to be a rather painful step, but careful planning will alleviate the pain. Here are some examples:

    • Your modeling pipeline spits out a pickle file with the trained model. All of your data access and feature engineering code was implemented as a set of Python functions. You need to deploy your model into a Python application. You create a Python package which includes the necessary function and the model pickle file as a file resource inside. You remember to test your code. The deployment procedure is a simple package installation followed by a run of integration tests.
    • Your pipeline spits out a pickle file with the trained model. To deploy the model you create a REST service using Flask, package it as a docker container and serve via your company's Kubernetes cloud. Alternatively, you upload the saved model to an S3 bucket and serve it via Amazon Lambda. You make sure your deployment is tested.
    • Your training pipeline produces a TensorFlow model. You use Tensorflow Serving (or any of the alternatives) to serve it as a REST service. You do not forget to create tests and run them every time you update the model.
    • Your pipeline produces a PMML file. Your Java application can read it using the JPMML library. You make sure that your PMML exporter includes model validation tests in the PMML file.
    • Your pipeline saves the model and the description of the preprocessing steps in a custom JSON format. To deploy it into your C# application you have developed a dedicated component which knows how to load and execute these JSON-encoded models. You make sure you have 100% test coverage of your model export code in Python, the model import code in C# and predictions of each new model you deploy.
    • Your pipeline compiles the model into an SQL query using SKompiler. You hard-code this query into your application. You remember about testing.
    • You train your models via a paid service, which also offers a way to publish them as REST (e.g. Azure ML Studio, YHat ScienceOps). You pay a lot of money, but you still test the deployment.

    Summarizing this:

    1. There are many ways how a model can be deployed. Make sure you understand your circumstances and plan ahead. Will you need to deploy the model into a codebase written in a different language than the one you use to train it? If you decide to serve it via REST, what load does the service expect, should it be capable of predicting in batches? If you plan to buy a service, estimate how much it will cost you. If you decide to use PMML, make sure it can support your expected preprocessing logic and that fancy Random Forest implementation you plan to use. If you used third party data sources during training, think whether you will need to integrate with them in production and how will you encode this access information in the model exported from your pipeline.
    2. As soon as you deploy your model to production, it turns from an artefact of data science to actual code, and should therefore be subject to all the requirements of application code. This means testing. Ideally, your deployment pipeline should produce both the model package for deployment as well as everything needed to test this model (e.g. sample data). It is not uncommon for the model to stop working correctly after being transferred from its birthplace to a production environment. It may be be a bug in the export code, a mismatch in the version of pickle, a wrong input conversion in the REST call. Unless you explicitly test the predictions of the deployed model for correctness, you risk running an invalid model without even knowing it. Everything would look fine, as it will keep predicting some values, just the wrong ones.

    Model monitoring

    Your data science project does not end when you deploy the model to production. The heat is still on. Maybe the distribution of inputs in your training set differs from the real life. Maybe this distribution drifts slowly and the model needs to be retrained or recalibrated. Maybe the system does not work as you expected it to. Maybe you are into A-B testing. In any case you should set up the infrastructure to continuously collect data about model performance and monitor it. This typically means setting up a visualization dashboard, hence the primary example would be the following:

    • For every request to your model you save the inputs and the model's outputs to logstash or a database table (making sure you stay GDPR-compliant somehow). You set up Metabase (or Tableau, MyDBR, Grafanaetc) and create reports which visualize the performance and calibration metrics of your model.

    Exploration and reporting

    Throughout the life of the data science project you will constantly have to sidestep from the main modeling pipeline in order to explore the data, try out various hypotheses, produce charts or reports. These tasks differ from the main pipeline in two important aspects.

    Firstly, most of them do not have to be reproducible. That is, you do not absolutely need to include them in the computation graph as you would with your data preprocessing and model fitting logic. You should always try to stick to reproducibility, of course - it is great when you have all the code to regenerate a given report from raw data, but there would still be many cases where this hassle is unnecessary. Sometimes making some plots manually in Jupyter and pasting them into a Powerpoint presentation serves the purpose just fine, no need to overengineer.

    The second, actually problematic particularity of these "Exploration" tasks is that they tend to be somewhat disorganized and unpredictable. One day you might need to analyze a curious outlier in the performance monitoring logs. Next day you want to test a new algorithm, etc. If you do not decide on a suitable folder structure, soon your project directory will be filled with notebooks with weird names, and no one in the team would understand what is what. Over the years I have only found one more or less working solution to this problem: ordering subprojects by date. Namely:

    • You create a projects directory in your project folder. You agree that each "exploratory" project must create a folder named projects/YYYY-MM-DD - Subproject title, where YYYY-MM-DD is the date when the subproject was initiated. After a year of work your projects folder looks as follows:
      ./2017-01-19 - Training prototype/
                      (README, unsorted files)
      ./2017-01-25 - Planning slides/
                      (README, slides, images, notebook)
      ./2017-02-03 - LTV estimates/
                       README
                       tasks/
                         (another set of 
                          date-ordered subfolders)
      ./2017-02-10 - Cleanup script/
                       README
                       script.py
      ./... 50 folders more ...
      

      Note that you are free to organize the internals of each subproject as you deem necessary.  In particular, it may even be a "data science project" in itself, with its own raw/processed data subfolders, its own Makefile-based computation graph, as well as own subprojects (which I would tend to name tasks in this case). In any case, always document each subproject (have a README file at the very least). Sometimes it helps to also have a root projects/README.txt file, which briefly lists the meaning of each subproject directory.

      Eventually you may discover that the project list becomes too long, and decide to reorganize the projects directory. You compress some of them and move to an archive folder. You regroup some related projects and move them to the tasks subdirectory of some parent project.

    Exploration tasks come in two flavors. Some tasks are truly one-shot analyses, which can be solved using a Jupyter notebook that will never be executed again. Others aim to produce reusable code (not to be confused with reproducible outputs). I find it important to establish some conventions for how the reusable code should be kept. For example, the convention may be to have a file named script.py in the subproject's root which outputs an argparse-based help message when executed. Or you may decide to require providing a run function, configured as a Celery task, so it can easily be submitted to the job queue. Or it could be something else - anything is fine, as long as it is consistent.

    The service checklist

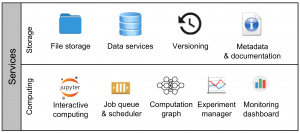
    There is an other, orthogonal perspective on the data science workflow, which I find useful. Namely, rather than speaking about it in terms of a pipeline of processes, we may instead discuss the key services that data science projects typically rely upon. This way you may describe your particular (or desired) setup by specifying how exactly should each of the following 9 key services be provided:

    Data science services

    Data science services

    1. File storage. Your project must have a home. Often this home must be shared by the team. Is it a folder on a network drive? Is it a working folder of a Git repository? How do you organize its contents?
    2. Data services. How do you store and access your data? "Data" here includes your source data, intermediate results, access to third-party datasets, metadata, models and reports - essentially everything which is read by or written by a computer. Yes, keeping a bunch of HDF5 files is also an example of a "data service".
    3. Versioning. Code, data, models, reports and documentation - everything should be kept under some form of version control. Git for code? Quilt for data? DVC for models? Dropbox for reports? Wiki for documentation? Once we're at it, do not forget to set up regular back ups for everything.
    4. Metadata and documentation. How do you document your project or subprojects? Do you maintain any machine-readable metadata about your features, scripts, datasets or models?
    5. Interactive computing. Interactive computing is how most of the hard work is done in data science. Do you use JupyterLab, RStudio, ROOT, Octave or Matlab? Do you set up a cluster for interactive parallel computing (e.g. ipyparallel or dask)?
    6. Job queue & scheduler. How do you run your code? Do you use a job processing queue? Do you have the capability (or the need) to schedule regular maintenance tasks?
    7. Computation graph. How do you describe the computation graph and establish reproducibility? Makefiles? DVC? Airflow?
    8. Experiment manager. How do you collect, view and analyze model training progress and results? ModelDB? Hyperdash? FloydHub?
    9. Monitoring dashboard. How do you collect and track the performance of the model in production? Metabase? Tableau? PowerBI? Grafana?

    The tools

    To conclude and summarize the exposition, here is a small spreadsheet, listing the tools mentioned in this post (as well as some extra ones I added or will add later on), categorizing them according to which stages of the data science workflow (in the terms defined in this post) they aim to support. Disclaimer - I did try out most, but not all of them. In particular, my understanding of the capabilities of the non-free solutions in the list is so far only based on their online demos or descriptions on the site.

    Tags: , , , , ,

  • Posted by Konstantin 28.06.2018 No Comments

    I had to replace my SIM card today. The old one was mini-sized and I needed a micro-sized one. My previous SIM card stayed with me for about 20 years or so. I have gone through high school, university, and traveled around to countless places with it. I changed my phone several times, starting from an older, bulkier Nokia through several candy-bar Nokias and a couple of smartphones. My personal computer evolved from a 200MHz Pentium with 16MB RAM to a 2.8GHz quad-core with 32GB RAM. But my SIM card always stayed the same. Let me dedicate this post to the memory of this glorious tiny computer - the most long-lasting and reliable piece of computing equipment I have ever used.

    My retiring SIM card. The mobile operator changed its name from Radiolinja to Elisa in 2000, but the SIM stayed.

    My retiring SIM card. The mobile operator changed its name from Radiolinja to Elisa in 2000, but the SIM card did not care.

    What is a SIM card?

    Your SIM card is just another smart card, technologically similar to any of the "chip-and-pin" bank cards in your wallet, your ID card and even your contactless public transport tickets (which communicate using the same set of protocols, just wirelessly). Note, however, that banks started to switch from magnetic to "chip-and-pin" credit cards and countries began issuing smart-card-based identity documents only about 15 years ago or so. SIM cards, on the other hand, had been in wide use much earlier, long before the term "smart card" became a popularized buzzword.

    All smart cards are built to serve one primary purpose - identification. The card stores a secret key (which is impossible to retrieve without disassembling the card using ultra-high-tech lab equipment), and provides a way to execute the following challenge-response protocol: you send a random string (a challenge) to the card. The card encrypts the string using the stored key and returns the response. The correctness of this response can now be verified by a second party (e.g. the mobile operator, the bank or a website using ID-card authentication). The actual details of the computation differ among the various smart cards. For example, some use symmetric while other - asymmetric cryptography. Some cards provide additional services, such as creating digital signatures or storing information on the card. None the less, identification is always the core function. This explains the name of the SIM card: Subscriber Identity Module. It is a module, which identifies you (the subscriber) to the network provider.

    What is inside a SIM card?

    The best way to understand what is inside a SIM (or any other type of smart-) card is to connect it to your computer and "talk" to it. Many laptops have integrated smart-card readers nowadays, so if you find a suitable frame for your nano/micro/mini-SIM, you may simply put it into the reader just as you would do with an ID or a bank card.

    Mini-SIM in a frame

    Old mini-SIM in a frame from a newer card

    Note, though, that if your frame is flimsy and not fitting perfectly (as is mine on the photo above) you run the risk of losing the chip somewhere in the depths of the card reader slot before you even manage to slide it in completely. Hence, in my case, a tiny cross-style USB card reader was a more convenient and reliable option:

    SIM in a frame in a reader

    SIM in a frame in a reader

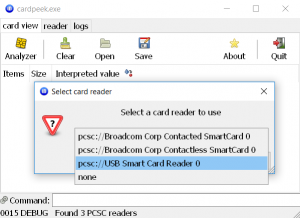
    Plug it in, wait until the system recognizes the device, and we are ready to talk. There are many tools for "talking" to the card on a low level, but one of the best for the purposes of educational exploration is, in my opinion, the program called CardPeek. Let us fire it up. At start up it asks for the card reader to use (note that you can use it to explore both contact and contactless cards, if you have the necessary reader):

    Select reader screen

    Select reader screen

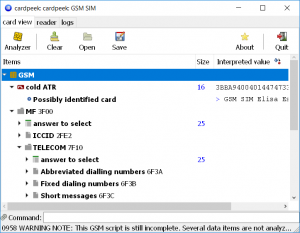
    We can now click "Analyzer → GSM SIM", provide the PIN, wait a bit, and have the program extract a wealth of information stored on the card:

    SIM card analyzed

    SIM card analyzed

    Fun, right? Let us now see where all this data came from and what it actually means.

    How does it work?

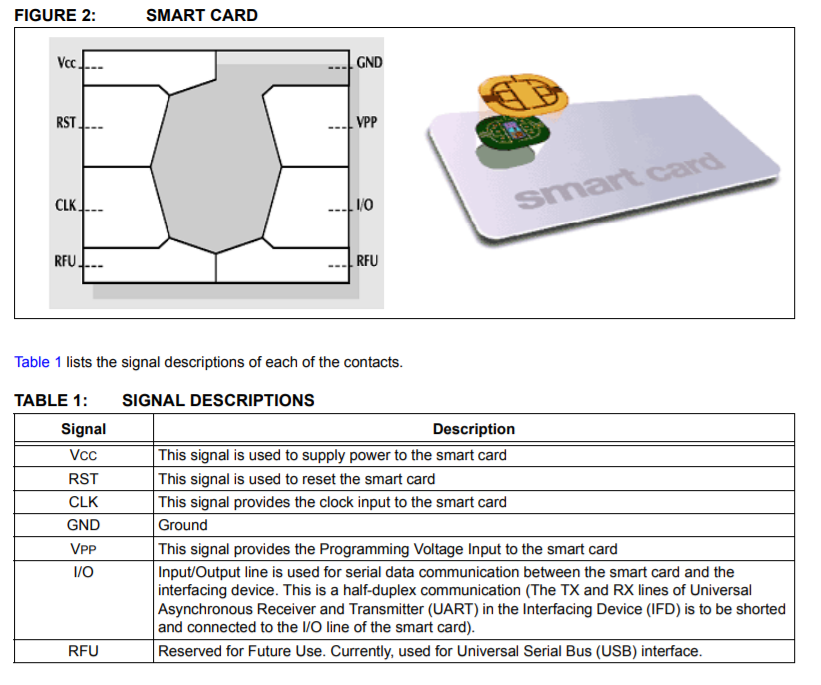
    At the hardware level, a smart card has a very simple connector with six active pins, which are designed for sending and receiving data to and from the card:

    Smart card connectors

    Smart card connectors (source)

    Four pins (VCC, GND, CLK, I/O) are used for the basic half-duplex synchronous serial communication. RST is the reset pin, and VPP is used for supplying the higher voltage when (re)programming the card. When you first connect to the card, the protocol requires to zero the "reset" pin, to which the card will reply by sending a fixed sequence of bytes, identifying the card and its capabilities. It is known as the card's ATR ("Answer To Reset") string. You can see this string listed as the "cold ATR" entry in the screenshot named "SIM card analyzed" above.

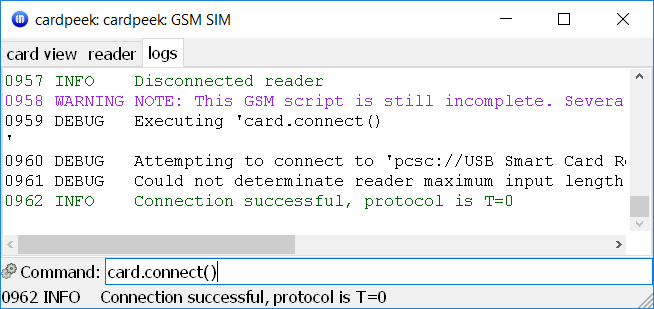
    Besides providing pre-packaged analysis scripts for various kinds of smart cards, CardPeek allows to send custom commands to the card by using its Lua scripting interface directly. This is what the "Command" text input at the bottom of the screen is for. Let us now switch to the "logs" tab and try sending some commands. First of all, we need to establish the connection to the card. This is done via the card.connect() call:

    card.connect()

    card.connect() example

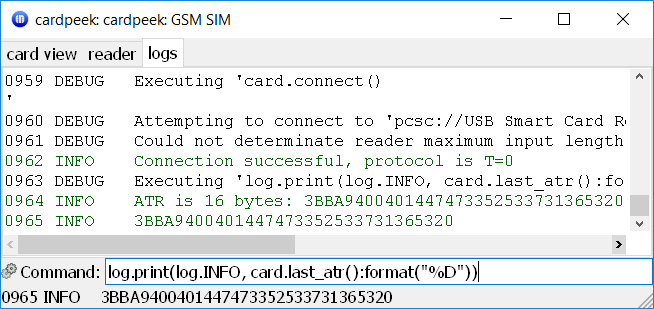
    The ATR string is received by the reader when the connection is first established. We can obtain it via card.last_atr() and print out to the log window in hex-encoded form using log.print and bytes:format (the documentation for all these APIs is available here):

    ATR

    ATR example

    As we see, the ATR for my card happens to be 3BBA9400401447473352533731365320 (in hex).  If you search the web, you will find that this particular ATR is known to be  a signature of the Elisa SIM cards. It is not a random string, though, and every byte has a meaning. In particular:

    • 3B is the "initial byte", and this particular value identifies the smart card as a SIM card.
    • BA is the "format" byte. Its first four bits (1011) tell us that we have to expect fields TA1, TB1 and TD1 to follow. The last four bits denote the number 10 - the number of "historical bytes" at the end of the ATR.
    • 94 is the field TA1, specifying the clock rate of the serial protocol
    • 00 is the field TB1, specifying the programming voltage (apparently, the card is not re-programmable)
    • 40 tells us that we have to read out another byte field TC2 (this is in the left-side part of the byte, 4 ) and that the card uses T=0 protocol (this is in the right-side part, 0).
    • 14 is the promised TC2 field (not sure what it is meant for),
    • the last 10 bytes are the "historical bytes", providing card manufacturer-specific information.

    Greeting your Card

    Now that we are connected, we can send various commands to the card. Let us proceed by example. The first command we might want to send is "VERIFY CHV", which is essentially greeting the card by providing our PIN1 code ("CHV" stands for "Card Holder Verification").

    VERIFY CHV

    VERIFY CHV (source)

    Every smart card command starts with a two-byte identifier (for example, A0 20 is the (hex) identifier of the VERIFY CHV command). It is followed by two parameter bytes P1 and P2. For example, the parameter P1 for VERIFY CHV is always 0, and P2 must indicate the number of the PIN we are submitting (i.e. 1 for PIN1, 2 for PIN2). Next comes P3 - a byte, specifying the length of the data which follows. For VERIFY CHV the data is the provided PIN itself, and it is always 8 bytes long. If the PIN is shorter than 8 bytes, it must be padded by bytes FF. The PIN itself is encoded in plain ASCII (i.e. 1234 would be 31 32 33 34).

    Now, supposing my PIN1 is, in fact "1234", I can authenticate myself to the card via CardPeek as follows:

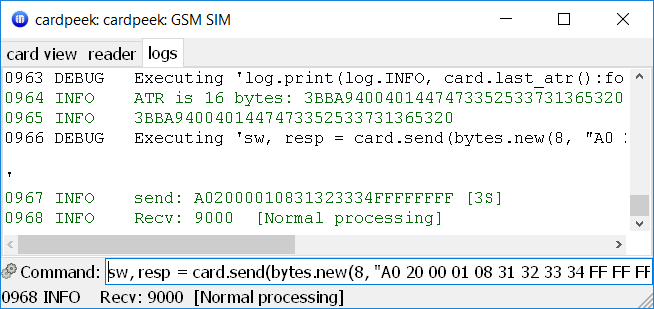
    sw, resp = card.send(bytes.new(8, "A0 20 00 01 08 31 32 33 34 FF FF FF FF"))

    Here, card.send is the sending command and bytes.new(8, ...) constructs an array of 8-bit bytes from a hex string (see CardPeek reference).

    The sw and resp are the two components of the T=0 protocol response. For VERIFY CHV we only care that sw is equal to 9000, which means "OK". Note how this is printed in the log.

    VERIFY CHV

    VERIFY CHV example

    Beware that if you do not receive a 9000 response, it means that the card denied your PIN for some reason. Trying to submit a wrong PIN three times in a row will block the card.

    Reading the Data

    Now that we have identified ourselves to the card, let us try to read the data stored on it. The data on the card is organized in a hierarchy of files. It is this exact hierarchy that you can observe as the output of the "Analyzer" script. The root file is called "MF", it has the ICCID, TELECOM and GSM sub-files, which, in turn, have a number of predefined sub-files themselves, etc. The names are just conventions, the card itself uses two-byte identifiers for each file. For example, "MF" is actually 3F 00, "TELECOM" is 7F 10, etc. While the card is connected you can navigate around the file structure just like you would do in a normal operating system using the cd command, except that in smart-card lingo the corresponding command is called SELECT.

    The binary form of the SELECT command is A0 A4 00 00 02 {x} {y}, where {x} {y} is the file identifier. Just like before, A0 A4 is the command code, 00 00 are the ignored P1 and P2 parameters, and 02 tells us that exactly two bytes must follow.

    Consequently, if we wanted to select the file "MF (3f 00)/TELECOM (7F 10)/ADN (6F 3A)", which contains the address book records, we could achieve it by sending the following sequence of commands via CardPeek:

    card.send(bytes.new(8, "A0 A4 00 00 02 3F 00"))
    card.send(bytes.new(8, "A0 A4 00 00 02 7F 10"))
    card.send(bytes.new(8, "A0 A4 00 00 02 6F 3A"))

    Selecting files is a common task, and CardPeek provides a convenient shorthand: card.select("#7f10"). For some cards (not mine, unfortunately) it should also be possible to do things like card.select("/7f10/6f3a").

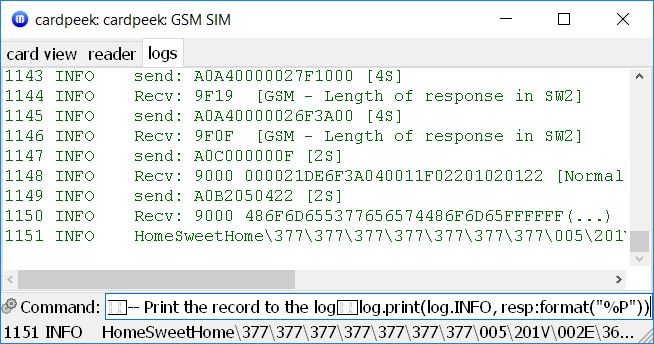
    Once we have selected the ADN ("Abbreviated Dialing Numbers") file, we may read out the individual phone numbers from it using the READ RECORD command. The procedure is complicated by the fact that READ RECORD needs to be provided the "record size" as one of its parameters, which, in turn, must be taken from the response data of the last SELECT command, and this must be obtained via the GET RESPONSE command. The complete example would therefore be:

    -- Select /TELECOM/ADN
    card.select("#7F10")
    sw, resp = card.select("#6F3A")
    
    -- Read file metadata
    GET_RESPONSE = "A0 C0 00 00"
    sw, resp = card.send(bytes.new(8, GET_RESPONSE, bit.AND(sw, 0xff)))
    
    -- Read out first record in the file
    sw, resp = card.read_record('.', 1, resp:get(14))
    
    -- Print the record to the log
    log.print(log.INFO, resp:format("%P"))
    Reading out a phone record

    Reading out a phone record

    Note that instead of printing the output to the log via log.print you could also show a message box:

    ui.readline(resp:format("%P"))

    or append a new node to the tree in the "card view" tab:

    nodes.append(nodes.root(), {classname="block", 
                                label="Name", 
                                val=resp:format("%P"), 
                                size=#resp})
    

    In fact, at this point you should go and read the script $HOME/.cardpeek/scripts/gsm (beta).lua. It contains the code we ran in the beginning of this post to analyze the card. The script simply sends the relevant commands to the card and appends all responses as nodes to the tree.

    Authentication

    While data storage is a useful capability of a SIM card, its main purpose is subscriber authentication. Thus, our acquaintance with the SIM card would be incomplete without checking the corresponding function out as well. It is quite simple:

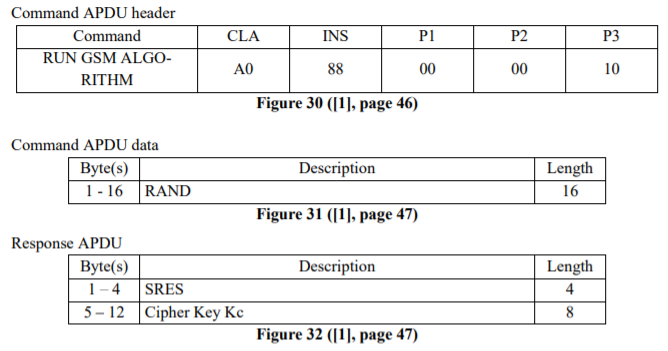
    RUN GSM ALGORITHM

    RUN GSM ALGORITHM (source)

    That is, the process is the following: we send the byte sequence A0 88 00 00 10, followed by a 16 byte-long challenge string (which is normally given by the mobile operator when the phone joins the network). The SIM card responds with 12 bytes, of which the first 4 we should send back to the mobile operator for verification, and use the remaining 8 as a cipher key.

    Before we can use the RUN GSM ALGORITHM command we need to verify our PIN1 (already done) and SELECT the GSM (7F 20) file:

    RUN_GSM_ALGO = "A0 88 00 00 10"
    GET_RESPONSE = "A0 C0 00 00"
    DF_GSM = "#7F20"
    
    CHALLENGE_STRING = "00 00 00 00 00 00 00 00 00 00 00 00 00 00 00 00"
    
    -- Select GSM file
    card.select(DF_GSM)
    
    -- Send the challenge data
    sw, resp = card.send(bytes.new(8, RUN_GSM_ALGO, CHALLENGE_STRING))
    
    -- Read 12-byte-long response
    sw, RESPONSE_STRING = card.send(bytes.new(8, GET_RESPONSE, 12))
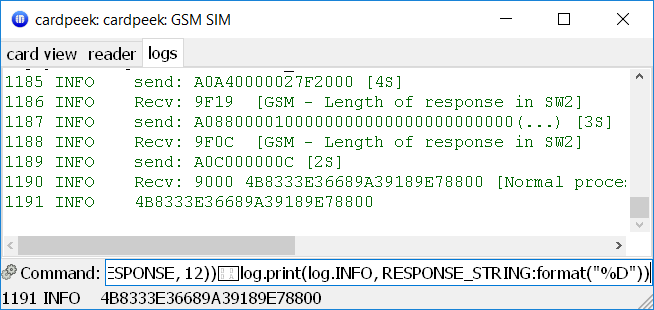
    log.print(log.INFO, RESPONSE_STRING:format("%D"))
    RUN GSM ALGORITHM example

    RUN GSM ALGORITHM example

    And that is it. I hope you learned to understand and appreciate your SIM card a bit more today.

    Tags: , , , , , ,

  • Posted by Konstantin 18.04.2018 No Comments

    Every once in a while I happen to find myself in a public network, where all access besides HTTP and HTTPS is blocked by the firewall. This is extremely inconvenient, as I routinely need to access SSH, VPN or other ports besides HTTP(S). Over time I have developed a reasonably fast and simple way of overcoming the restriction whenever I need it. Let me document it here.

    Google Cloud Shell

    There are probably hundreds of cloud providers nowadays, each of them trying to outcompete the others by offering better, cheaper, faster, or more diverse set of services. One killer feature of the Google Cloud platform is its cloud shell, which gives you command-line access to a tiny Linux virtual machine directly from their webpage for free:

    Once you are logged into Google Cloud platform you may open the shell here

    Once you are logged into Google Cloud platform you may open the shell window via this button

    Even if you do not have any serious use for a cloud provider, the cloud shell is one good reason to get an account at the Google Cloud platform. Because whenever I find myself locked out of SSH behind a paranoid firewall, I can still SSH into any of my servers via the cloud shell. This works even when your access is limited to an HTTP proxy server.

    Once upon a time there was a great service named koding.com, which also provided free access to a Linux console via HTTP. Unfortunately, they have changed their pricing model since then and do not seem to have any similar free offerings anymore. If you know any alternative services that offer a web-based shell access to a Linux VM for free, do post them in the comments.

    OpenVPN via HTTPS

    Sometimes SSH access offered by the cloud shell is not enough. For example, I would often need to access the company's VPN server. It runs on port 1194 and in a properly paranoid network this port is, of course, also blocked. The way to sneak through this restriction is the following.

    1. Launch a server in the cloud, running an OpenVPN service on port 443 (which corresponds to HTTPS). Even the most paranoid firewalls would typically let HTTPS traffic through, because otherwise they would block most of the web for their users.
    2. Connect to that VPN server and tunnel all traffic through it to the outside world.
    3. Now we are free to connect anywhere we please. In particular, we may open a VPN tunnel to the company's server from within that "outer" VPN tunnel.
    4. At this point I would sometimes SSH into a machine behind the company's VPN and never cease to be amused by the concept of having a SSH tunnel within a VPN tunnel within another VPN tunnel.

    Let us now go through all these steps in detail.

    Setting up an OpenVPN server

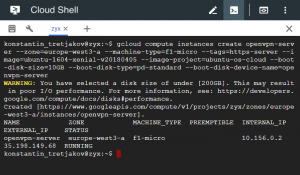
    We start by launching a machine in the cloud. You are free to choose any cloud provider here, but as we are using Google's cloud shell already anyway (we are working behind a paranoid firewall already, remember), it makes sense to launch the server from Google's cloud as well. This can be as simple as copy-pasting the following command into the same cloud shell prompt:

    gcloud compute instances create openvpn-server --zone=europe-west3-a --machine-type=f1-micro --tags=https-server --image=ubuntu-1604-xenial-v20180405 --image-project=ubuntu-os-cloud --boot-disk-size=10GB --boot-disk-type=pd-standard --boot-disk-device-name=openvpn-server

    (obviously, detailed documentation of Google cloud functionality is way beyond the scope of this blog post. All the necessary references and tutorials are rather easy to find, though).  You may play with some of the settings passed to the command above, however the choice of the ubuntu-1604-*** image is important, because the script from the next part was only ever tested on that Linux version. The chosen machine type (f1-micro) is the cheapest and should cost around 5 euros per month (if you keep it open constantly), or a matter of cents, if you only use it for some hours.

    Launching a machine in the cloud

    Launching a machine in the cloud

    Once the machine is up, we SSH into it by typing:

    gcloud compute ssh openvpn-server

    Here we'll need to install and configure the OpenVPN server. This may be a fairly lengthy process of following step-by-step instructions from, for example, this well-written tutorial. Luckily, I've gone through this already and wrote down all the steps down into a replayable script, which seems to work fine so far with the chosen Linux image. Of course, there's no guarantee it will continue working forever (some rather loose configuration editing is hard-coded there). However, as we have just launched a throwaway virtual server, the worst that can happen is the need to throw that server away if it breaks. (Do not run the script blindly on a machine you care about, though). So let's just download and run it:

    curl -s https://gist.githubusercontent.com/konstantint/08ab09202b68e4e3542622e99d21a82e/raw/1a3ee68008d5b565565ebb8c126ae68a8cebe549/ovpn_setup.sh | bash -s

    Once completed, the script prints the filename "/home/<username>/client-configs/files/client1.ovpn". This is the name of the file which we need to transfer back to our computer. A clumsy, yet fast and straightforward way is to simply copy-paste its contents from the shell into a local text file:

    cat /home/your_username/client-configs/files/client1.ovpn

    We then select all the output starting from the first lines of the file

    client
    dev tun
    proto tcp
    ...

    all the way down to

    ...
    -----END OpenVPN Static key V1-----
    </tls-auth>

    (holding "shift", scrolling and clicking the mouse helps).

    We then create a new file (on the local machine), name it client1.ovpn (for example), paste the copied text and save. That's it, we have successfully set up an OpenVPN server running on port 443. Type exit in the cloud shell to log out of the server as we don't need to configure anything there.

    Setting up an OpenVPN client

    Next we must set up an OpenVPN client on the local computer. I am using a Windows laptop, hence the instructions are Windows-specific, although the logic for Linux or Mac should be rather similar. First, install OpenVPN. The nicest way to do it in Windows is via Chocolatey. Open cmd.exe with administrative privileges and:

    1. Install Chocolatey, if you still don't have it (trust me, it's a good piece of software to have):

    @"%SystemRoot%\System32\WindowsPowerShell\v1.0\powershell.exe" -NoProfile -InputFormat None -ExecutionPolicy Bypass -Command "iex ((New-Object System.Net.WebClient).DownloadString('https://chocolatey.org/install.ps1'))" && SET "PATH=%PATH%;%ALLUSERSPROFILE%\chocolatey\bin"

    2. Now install OpenVPN (if you still don't have it):

    choco install -y openvpn

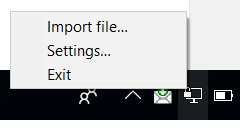
    3. Launch OpenVPN GUI (Windows button + type "OpenV" + Enter), right-click on the newly appeared tray icon, select "Import File..." and choose the client1.ovpn file we created:

    Import OVPN file

    Import OVPN file

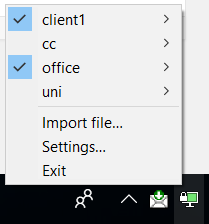
    4. Once you've done it, the OpenVPN tray menu will offer you a "Connect" option (or a "client1" submenu with a "Connect" option if you have other connections configured already). Click it, observe the connection dialog, wait until the tray icon becomes green, and congratulations, all your traffic is now tunneled through port 443 of the cloud machine you launched some minutes ago.

    OpenVPN client connected

    Connected

    You may verify the effect by googling the words "my ip". You are now also free to connect to any ports or services you need.

    Tunnel in a Tunnel

    As I mentioned in the beginning, having freed myself from the firewalls of a paranoid network administrator, I would then sometimes need to connect to a corporate or a university VPN. This happens to be surprisingly easy (this part is, however, Windows specific - I am not sure how an equivalent action should look like on Linux or Mac, although I'm sure it should be possible).

    1. OpenVPN uses a virtual network tunnel adapter to forward traffic. Initially it only installs one such adapter, but if you want to run a tunnel within a tunnel you will need to add a second one. This is done by simply running C:\Program Files\TAP-Windows\bin\addtap.bat with administrator privileges. It only needs to be done once, of course (unless you need to run a tunnel within a tunnel within a tunnel - then you need to add a a third TAP adapter by running addtap.bat again).
    2. Now running a VPN within a VPN is simply a matter of asking OpenVPN to "Connect" to VPNs in the appropriate order. As we are already connected to client1, we simply connect to another profile without disconnecting the first one - this will happily forward a tunnel through an existing tunnel. Fun, right?
    VPN via VPN

    VPN via VPN

    Cleaning Up

    If you only needed the VPN temporarily, do not forget to destroy the cloud machine before going home - otherwise you'll have to pay the unnecessary costs of keeping a server up. Destroying servers is simple. Just go back to the cloud shell where we launched the server and run:

    gcloud compute instances delete openvpn-server

    That's it. You are back at the mercy of the firewalls.

    Tags: , , , , , ,

  • Posted by Konstantin 17.03.2018 3 Comments

    I have randomly stumbled upon a Quora question "Can you write a program for adding 10 numbers" yesterday. The existing answers competed in geeky humor and code golf, so I could not help adding another take on the problem.

    Can you write a program for adding 10 numbers?

    The question offers a great chance to illustrate how to properly develop software solutions to real-life problems such as this one.

    First things first - let us analyze the requirements posed by the customer. They are rather vague, as usual. It is not clear what “numbers” we need to add, where and how should these “numbers” come from, what is really meant under “adding”, what should we do with the result, what platform the software is supposed to be running on, what are the service guarantees, how many users are expected, etc.

    Of course, we do not want to discover that we misunderstood some of the requirements late in the development cycle, as this could potentially require us to re-do all of the work. To avoid such unpleasant surprises we should be planning for a general, solid, enterprise-grade solution to the problem. After a short meeting of the technical committee we decided to pick C# as the implementation platform. It is OS-independent and has many powerful features which should cover any possible future needs. For example, if the customer would decide to switch to a cluster-based, parallel implementation later along the way, we’d quickly have this base covered. Java could also be a nice alternative, but, according to the recent developer surveys, C# development pays more.

    The Architecture

    Let us start by modeling the problem on a higher level. The customer obviously needs to process (“add”) some data (“10 numbers”). Without getting into too much detail, this task can be modeled as follows:

    interface IInputProvider {}
    interface IOutput {}
    interface ISolution {
        IOutput add10(IInputProvider input);    
    }

    Note how we avoid specifying the actual sources of input and output yet. Indeed, we really don’t know where the “10 numbers” may be coming from in the future - these could be read from standard input, sent from the Internet, delivered by homing pigeons, or teleported via holographic technology of the future - all these options are easily supported by simply implementing IInputProvider appropriately.

    Of course, we need to do something about the output once we obtain it, even though the customer forgot to mention this part of the problem. This means we will also have to implement the following interface:

    interface IOutputConsumer {
        void consumeOutput(IOutput output);
    }

    And that is it - our general solution architecture! Let us start implementing it now.

    The Configuration

    The architecture we work with is completely abstract. An actual solution would need to provide implementations for the IInputProviderIOutputConsumer and ISolution interfaces. How do we specify which classes are implementing these interfaces? There are many possibilities - we could load this information from a database, for example, and create a dedicated administrative interface for managing the settings. For reasons of brevity, we’ll illustrate a simplistic XML-based factory method pattern.

    Namely, we shall describe the necessary implementations in the XML file config.xml as follows:

    <Config>
        <InputProvider class="Enterprise.NumberSequenceProvider"/>
        <OutputConsumer class="Enterprise.PeanoNumberPrinter"/>
        <Solution class="Enterprise.TenNumbersAddingSolution"/>
    </Config>

    A special SolutionFactory class can now load this configuration and create the necessary object instances. Here’s a prototype implementation:

    class SolutionFactory {
        private XDocument cfg;
        public SolutionFactory(string configFile) {
            cfg = XDocument.Load(configFile);
        }
        public IInputProvider GetInputProvider() {
            return Instantiate<IInputProvider>("InputProvider");
        }
        public IOutputConsumer GetOutputConsumer() {
            return Instantiate<IOutputConsumer>("OutputConsumer");
        }
        public ISolution GetSolution() {
            return Instantiate<ISolution>("Solution");
        }
        private T Instantiate<T>(string elementName) {
            var typeName = cfg.Root.Element(elementName)
                                   .Attribute("class").Value;
            return (T)Activator.CreateInstance(Type.GetType(typeName));
        }
    }

    Of course, in a real implementation we would also worry about specifying the XML Schema for our configuration file, and make sure it is possible to override the (currently hard-coded) “config.xml” file name with an arbitrary URI using command-line parameters or environment variables. In many real-life enterprise solutions in Java, for example, even the choice of the XML parsing library would need to be configured and initialized using its own factory pattern. I omit many of such (otherwise crucial) details for brevity here.

    I am also omitting the unit-tests, which, of course, should be covering every single method we are implementing.

    The Application

    Now that we have specified the architecture and implemented the configuration logic, let us put it all together into a working application. Thanks to our flexible design, the main application code is extremely short and concise:

    class Program {
        static void Main(string[] args) {
            var sf = new SolutionFactory("config.xml");
            var ip = sf.GetInputProvider();
            var oc = sf.GetOutputConsumer();
            var sol = sf.GetSolution();
            var op = sol.add10(ip);
            oc.consumeOutput(op);
        }
    }

    Amazing, right? Well, it does not really work yet, of course, because we still need to implement the core interfaces. However, at this point we may conclude the work of the senior architect and assign the remaining tasks of filling in the blanks to the the main engineering team.

    The Inputs and Outputs

    Now that we have set up the higher-level architecture, we may think a bit more specifically about the algorithm we plan to implement. Recall that we need to “add 10 numbers”. We don’t really know what these “numbers” should be - they could be real numbers, complex numbers, Roman numerals or whatnot, so we have to be careful and not rush into making strict assumptions yet. Let’s just say that a “number” is something that can be added to another number:

    interface INumber {
        INumber add(INumber other);
    }

    We’ll leave the implementation of this interface to our mathematicians on the team later on.

    At this step we can also probably make the assumption that our IInputProviderimplementation should somehow give access to ten different instances of an INumber. We don’t know how these instances are provided - in the worst case each of them may be obtained using a completely different method and at completely different times. Consequently, one possible template for an IInputProvider could be the following:

    interface ITenNumbersProvider: IInputProvider {
        INumber GetNumber1();
        INumber GetNumber2();
        INumber GetNumber3();
        INumber GetNumber4();
        INumber GetNumber5();
        INumber GetNumber6();
        INumber GetNumber7();
        INumber GetNumber8();
        INumber GetNumber9();
        INumber GetNumber10();
    }

    Note how, by avoiding the use of array indexing, we force the compiler to require that any implementation of our ITenNumbersProvider interface indeed provides exactly ten numbers. For brevity, however, let us refactor this design a bit:

    enum NumberOfANumber {
        ONE, TWO, THREE, FOUR, FIVE, SIX, SEVEN, EIGHT, NINE, TEN
    }
    interface ITenNumbersProvider: IInputProvider {
        INumber GetNumber(NumberOfANumber noan);
    }

    By listing the identities of our “numbers” in an enum we still get some level of compile-time safety, although it is not as strong any more, because enum is, internally, just an integer. However, we god rid of unnecessary repetitions, which is a good thing. Refactoring is an important aspect of enterprise software development, you see.

    The senior architect looked at the proposed interface at one of our regular daily stand-ups, and was concerned with the chosen design. “Your interface assumes you can provide immediate access to any of the ten numbers”, he said. But what if the numbers cannot be provided simultaneously and will be arriving at unpredictable points in time? If this were the case, an event-driven design would be much more appropriate:

    delegate void NumberHandler(NumberOfANumber id, INumber n);
     
    interface IAsynchronousInputProvider: IInputProvider {
        void AddNumberListener(NumberHandler handler);
    }

    The adding subsystem would then simply subscribe to receive events about the incoming numbers and handle them as they come in.

    “This is all good and nice”, responded the mathematician, “but for efficient implementation of the addition algorithm we might need to have all ten numbers available at the same time”. “Ah, software design 101”, says the senior architect. We simply install an adapter class. It would pool the incoming data until we have all of it, thus converting the IAsynchronousInputProvider, used for feeding the data, into an ITenNumbersProvider, needed by the mathematician:

    class SyncronizationAdapter: ITenNumbersProvider {
       private Dictionary<NumberOfANumber, INumber> nums;
       private ManualResetEvent allDataAvailableEvent;
     
       public SynchronizationAdapter(IAsynchronousInputProvider ainput){
           nums = new Dictionary<NumberOfANumber, INumber>();
           allDataAvailableEvent = new ManualResetEvent(false);
           ainput.AddNumberListener(this.HandleIncomingNumber);
       }
       private void HandleIncomingNumber(NumberOfANumber id, INumber n){
           nums[id] = n;
           if (Enum.GetValues(typeof(NumberOfANumber))
                   .Cast<NumberOfANumber>()
                   .All(k => nums.ContainsKey(k)))
                allDataAvailableEvent.Set();
       }
       public INumber GetNumber(NumberOfANumber noan) {
           allDataAvailableEvent.WaitOne();
           return nums[noan];
       }
    }

    Now the mathematician can work on his addition logic without having to know anything about the way the numbers are coming in. Convenient, isn’t it?

    Note that we are still only providing the input interface specification (along with an adapter) here. The actual implementation has to wait until our mathematicians come up with an implementation of INumber and the data engineers decide on how to obtain ten of these in the most optimal way.

    But what about IOutput? Let us assume that we expect to output a single number. This means that INumber must itself already be an instance of IOutput:

    interface INumber: IOutput {
       INumber add(INumber other);
    }

    No need to implement anything, we just add an interface tag to INumber! See how object-oriented design techniques allow us to save development time!

    The Order of Addition

    OK, so we now have a concept of an INumber which has a (binary) addition operation defined, an ITenNumbersProvider which can provide ten INumber instances (conveniently abstracting away the IAsynchrhonousInputProvider which actually obtains the numbers), and our goal is to add them up to get an IOutput which is itself an INumber. Sounds easy, right? Not so fast! How exactly are we going to add these numbers? After all, maybe in some cases adding ((a+b)+c)+d)… can be less efficient or precise than (a+(b+(c+(d…. Or maybe the optimal addition strategy is to start from the middle and then add numbers in some order? There do exist nontrivial ways to add up numbers, you know. To accommodate for any possible options in the future (so that we wouldn’t have to rewrite the code unnecessarily), we should design our solution in a way that would let us switch our addition strategy easily, should we discover a better algorithm. One way to do it is by abstracting the implementation behind the following interface:

    interface IAdditionStrategy {
       INumber fold(Func<NumberOfANumber, INumber> elements,
                    Func<INumber, INumber, INumber> op); 
    }

    You see, it is essentially a functor, which gets a way to access our set of numbers (via an accessor function) along with a binary operator “op”, and “folds” this operator along the number set in any way it deems necessary. This particular piece was designed by Harry, who is a huge fan of functional programming. He was somewhat disappointed when we decided not to implement everything in Haskell. Now he can show how everyone was wrong. Indeed, the IAdditionStrategy is a core element of our design, after all, and it happens to look like a fold-functor which takes functions as inputs! “I told you we had to go with Haskell!”, says Harry! It would allow us to implement all of our core functionality with a much higher level of polymorphism than that of a simplistic C# interface!

    The Solution Logic

    So, if we are provided with the ten numbers via ITenNumbersProvider and an addition strategy via IAdditionStrategy, the implementation of the solution becomes a very simple matter:

    class TenNumbersAddingSolution: ISolution {
       private IAdditionStrategy strategy;
       public TenNumbersAddingSolution() {
           strategy = ...
       }
       public IOutput add10(IInputProvider input) {
           var tenNumbers = new SynchronizationAdapter(
                          (IAsynchronousInputProvider)input);
           return strategy.fold(i => tenNumbers.GetNumber(i), 
                                (x,y) => x.add(y));
       }
    }

    We still need to specify where to take the implementation of the IAdditionStrategy from, though. This would be a good place to refactor our code by introducing a dependency injection configuration framework such as the Autofac library. However, to keep this text as short as possible, I am forced to omit this step. Let us simply add the “Strategy” field to our current config.xml as follows:

    <Config>
        ...
        <Solution class="Enterprise.TenNumbersAddingSolution">
            <Strategy class="Enterprise.AdditionStrategy"/>
        </Solution>
    </Config>

    We could now load this configuration setting from the solution class:

        ...
        public TenNumbersAddingSolution() {
            var cfg = XDocument.Load("config.xml");
            var typeName = cfg.Root
                   .Element("Solution")
                   .Element("Strategy")
                   .Attribute("class").Value;
            strategy = (IAdditionStrategy)Activator
                   .CreateInstance(Type.GetType(typeName));
        }
        ...

    And voilà, we have our solution logic in place. We still need to implement INumberIAdditionStrategyITenNumbersProvider and IOutputConsumer, though. These are the lowest-level tasks that will force us to make the most specific decisions and thus determine the actual shape of our final product. These will be done by the most expert engineers and mathematicians, who understand how things actually work inside.

    The Numbers

    How should we implement our numbers? As this was not specified, we should probably start with the simplest possible option. One of the most basic number systems from the mathematician’s point of view is that of Peano natural numbers. It is also quite simple to implement, so let’s go for it:

    class PeanoInteger: INumber {
        public PeanoInteger Prev { get; private set; }
        public PeanoInteger(PeanoInteger prev) { Prev = prev; }
        public INumber add(INumber b) {
            if (b == null) return this;
            else return new PeanoInteger(this)
                    .add(((PeanoInteger)b).Prev);
        }
    }

    Let us have IOutputConsumer print out the given Peano integer as a sequence of “1”s to the console:

    class PeanoNumberPrinter: IOutputConsumer {
        public void consumeOutput(IOutput p) {
            for (var x = (PeanoInteger)p; x != null; x = x.Prev)
                 Console.Write("1");
            Console.WriteLine();
        }
    }

    Finally, our prototype IAdditionStrategy will be adding the numbers left to right. We shall leave the option of considering other strategies for later development iterations.

    class AdditionStrategy: IAdditionStrategy {
        public INumber fold(Func<NumberOfANumber, INumber> elements,
                            Func<INumber, INumber, INumber> op) {
           return Enum.GetValues(typeof(NumberOfANumber))
                      .Cast<NumberOfANumber>()
                      .Select(elements).Aggregate(op);
        }
    }

    Take a moment to contemplate the beautiful abstraction of this functional method once again. Harry’s work, no doubt!

    The Input Provider

    The only remaining piece of the puzzle is the source of the numbers, i.e. the IAsynchronousInputProvider interface. Its implementation is a fairly arbitrary choice at this point - most probably the customer will want to customize it later, but for the purposes of our MVP we shall implement a simple sequential asynchronous generator of Peano numbers {1, 2, 3, …, 10}:

    class NumberSequenceProvider: IAsynchronousInputProvider {
        private event NumberHandler handler;
        private ManualResetEvent handlerAvailable;
     
        public NumberSequenceProvider() {
            handlerAvailable = new ManualResetEvent(false);
            new Thread(ProduceNumbers).Start();
        }
        public void AddNumberListener(NumberHandler nh) {
            handler += nh;
            handlerAvailable.Set();
        }
        private void ProduceNumbers() {
            handlerAvailable.WaitOne();
            PeanoInteger pi = null;
            foreach (var v in Enum.GetValues(typeof(NumberOfANumber))
                                  .Cast<NumberOfANumber>()) {
                    pi = new PeanoInteger(pi);
                    handler(v, pi);
            }
        }
    }

    Note that we have to be careful to not start publishing the inputs before the number processing subsystem attaches to the input producer. To achieve that we rely on the event semaphore synchronization primitive. At this point we can clearly see the benefit of choosing a powerful, enterprise-grade platform from the start! Semaphores would look much clumsier in Haskell, don’t you think, Harry? (Harry disagrees)

    So here we are - we have a solid, enterprise-grade, asynchronous, configurable implementation for an abstractly defined addition of abstractly defined numbers, using an abstract input-output mechanism.

    $> dotnet run
    1111111111111111111111111111111111111111111111111111111

    We do need some more months to ensure full test coverage, update our numerous UML diagrams, write documentation for users and API docs for developers, work on packaging and installers for various platforms, arrange marketing and sales for the project (logo, website, Facebook page, customer relations, all that, you know), and attract investors. Investors could then propose to pivot the product into a blockchain-based, distributed solution. Luckily, thanks to our rock solid design abstractions, this would all boil down to reimplementing just a few of the lower-level interfaces!

    Software engineering is fun, isn’t it?

    The source code for the developed solution is available here.

    Tags: , , , , ,

  • Posted by Konstantin 06.12.2017 7 Comments

    Early stopping is a technique that is very often used when training neural networks, as well as with some other iterative machine learning algorithms. The idea is quite intuitive - let us measure the performance of our model on a separate validation dataset during the training iterations. We may then observe that, despite constant score improvements on the training data, the model's performance on the validation dataset would only improve during the first stage of training, reach an optimum at some point and then turn to getting worse with further iterations.

    The early stopping principle

    The early stopping principle

    It thus seems reasonable to stop training at the point when the minimal validation error is achieved. Training the model any further only leads to overfitting. Right? The reasoning sounds solid and, indeed, early stopping is often claimed to improve generalization in practice. Most people seem to take the benefit of the technique for granted. In this post I would like to introduce some skepticism into this view or at least illustrate that things are not necessarily as obvious as they may seem from the diagram with the two lines above.

    How does Early Stopping Work?

    To get a better feeling of what early stopping actually does, let us examine its application to a very simple "machine learning model" - the estimation of the mean. Namely, suppose we are given a sample of 50 points \mathbf{x}_i from a normal distribution with unit covariance and we need to estimate the mean \mathbf{w} of this distribution.

    Sample

    Sample

    The maximum likelihood estimate of \mathbf{w} can be found as the point which has the smallest sum of squared distances to all the points in the sample. In other words, "model fitting" boils down to finding the minimum of the following objective function:

        \[f_\mathrm{train}(\mathrm{w}) := \sum_{i=1}^{50} \Vert \mathbf{x}_i - \mathbf{w}\Vert^2\]

    As our estimate is based on a finite sample, it, of course, won't necessarily be exactly equal to the true mean of the distribution, which I chose in this particular example to be exactly (0,0):

    Sample mean as a minimum of the objective function

    Sample mean as a minimum of the objective function

    The circles in the illustration above are the contours of the objective function, which, as you might guess, is a paraboloid bowl. The red dot marks its bottom and is thus the solution to our optimization problem, i.e. the estimate of the mean we are looking for. We may find this solution in various ways. For example, a natural closed-form analytical solution is simply the mean of the training set. For our purposes, however, we will be using the gradient descent iterative optimization algorithm. It is also quite straightforward: start with any point (we'll pick (-0.5, 0) for concreteness' sake) and descend in small steps downwards until we reach the bottom of the bowl:

    Gradient descent

    Gradient descent

    Let us now introduce early stopping into the fitting process. We will split our 50 points randomly into two separate sets: 40 points will be used to fit the model and 10 will form the early stopping validation set. Thus, technically, we now have two different objective functions to deal with:

        \[f_\mathrm{fit}(\mathrm{w}) := \sum_{i=1}^{40} \Vert \mathbf{x}_i - \mathbf{w}\Vert^2\]

    and

        \[f_\mathrm{stop}(\mathrm{w}) := \sum_{i=41}^{50} \Vert \mathbf{x}_i - \mathbf{w}\Vert^2.\]

    Each of those defines its own "paraboloid bowl", both slightly different from the original one (because those are different subsets of data):

    Fitting and early stopping objectives

    Fitting and early stopping objectives

    As our algorithm descends towards the red point, we will be tracking the value of f_\mathrm{stop} at each step along the way:

    Gradient descent with validation

    Gradient descent with validation

    With a bit of imagination you should see on the image above, how the validation error decreases as the yellow trajectory approaches the purple dot and then starts to increase after some point midway. The spot where the validation error achieves the minimum (and thus the result of the early stopping algorithm) is shown by the green dot on the figure below:

    Early stopping

    Early stopping

    In a sense, the validation function now acts as a kind of a "guardian", preventing the optimization from converging towards the bottom of our main objective. The algorithm is forced to settle on a model, which is neither an optimum of f_\mathrm{fit} nor of f_\mathrm{stop}. Moreover, both f_\mathrm{fit} and f_\mathrm{stop} use less data than f_\mathrm{train}, and are thus inherently a worse representation of the problem altogether.

    So, by applying early stopping we effectively reduced our training set size, used an even less reliable dataset to abort training, and settled on a solution which is not an optimum of anything at all. Sounds rather stupid, doesn't it?

    Indeed, observe the distribution of the estimates found with (blue) and without (red) early stopping in repeated experiments (each time with a new random dataset):

    Solutions found with and without early stopping

    Solutions found with and without early stopping

    As we see, early stopping greatly increases the variance of the estimate and adds a small bias towards our optimization starting point.

    Finally, let us see how the quality of the fit depends on the size of the validation set:

    Fit quality vs validation set size

    Fit quality vs validation set size

    Here the y axis shows the squared distance of the estimated point to the true value (0,0), smaller is better (the dashed line is the expected distance of a randomly picked point from the data).  The x axis shows all possible sizes of the validation set. We see that using no early stopping at all (x=0) results in the best expected fit. If we do decide to use early stopping, then for best results we should split the data approximately equally into training and validation sets. Interestingly, there do not seem to be much difference in whether we pick 30%, 50% or 70% of data for the validation set - the validation set seems to play just as much role in the final estimate as the training data.

    Early Stopping with Non-convex Objectives

    The experiment above seems to demonstrate that early stopping should be almost certainly useless (if not harmful) for fitting simple convex models. However, it is never used with such models in practice. Instead, it is most often applied to the training of multilayer neural networks. Could it be the case that the method somehow becomes useful when the objective is highly non-convex? Let us run a small experiment, measuring the benefits of early stopping for fitting a convolutional neural-network on the MNIST dataset. For simplicity, I took the standard example from the Keras codebase, and modified it slightly. Here is the result we get when training the the most basic model:

    MNIST - Basic

    MNIST - Basic

    The y axis depicts log-loss on the 10k MNIST test set, the x axis shows the proportion of the 60k MNIST training set set aside for early stopping. Ignoring small random measurement noise, we may observe that using early stopping with about 10% of the training data does seem to convey a benefit. Thus, contrary to our previous primitive example, when the objective is complex, early stopping does work as a regularization method. Why and how does it work here? Here's one intuition I find believable (there are alternative possible explanations and measurements, none of which I find too convincing or clear, though): stopping the training early prevents the algorithm from walking too far away from the initial parameter values. This limits the overall space of models and is vaguely analogous to suppressing the norm of the parameter vector. In other words, early stopping resembles an ad-hoc version of \ell_p regularization.

    Indeed, observe how the use of early stopping affects the results of fitting the same model with a small \ell_2-penalty added to the objective:

    MNIST - L2

    MNIST - L2

    All of the benefits of early stopping are gone now, and the baseline (non-early-stopped, \ell_2-regularized) model is actually better overall than it was before. Let us now try an even more heavily regularized model by adding dropout (instead of the \ell_2 penalty), as is customary for deep neural networks. We can observe an even cleaner result:

    MNIST - Dropout

    MNIST - Dropout

    Early stopping is again not useful at all, and the overall model is better than all of our previous attempts.

    Conclusion: Do We Need Early Stopping?

    Given the reasoning and the anecdotal experimental evidence above, I personally tend to think that beliefs in the usefulness of early stopping (in the context of neural network training) may be well overrated. Even if it may improve generalization for some nonlinear models, you would most probably achieve the same effect more reliably using other regularization techniques, such as dropout or a simple \ell_2 penalty.

    Note, though, that there is a difference between early stopping in the context of neural networks and, say, boosting models. In the latter case early stopping is actually more explicitly limiting the complexity of the final model and, I suspect, might have a much more meaningful effect. At least we can't directly carry over the experimental examples and results in this blog post to that case.

    Also note, that no matter whether early stopping helps or harms the generalization of the trained model, it is still a useful heuristic as to when to stop a lengthy training process automatically if we simply need results that are good enough.


    Tags: , , , , , , ,

  • Posted by Konstantin 25.07.2017 3 Comments

    Every student of computer science, who has managed to keep even a tiny shred of attention at their algorithms course, should know that sorting n numbers is a task that requires at least \Omega(n \log n) time in general. There are some special cases, such as sorting small integers, where you can use counting sort or radix sort to beat this baseline, but as long as your numbers are hypothetically arbitrarily large, you are stuck with the \Omega(n \log n) lower bound. Right?

    Well, not really. One thing that many algorithms courses tend to skim over rather briefly is the discussion of the choice of the computation model, under which the algorithm of interest is supposed to run. In particular, the \Omega(n \log n) bound for sorting holds for the comparison-only model of computation — the abstract situation where the algorithm may only perform pairwise comparisons of the numbers to be sorted. No arithmetic, bit-shifts or anything else your typical processor is normally trained to do is allowed. This is, obviously, not a very realistic model for a modern computer.

    Let us thus consider a different computation model instead, which allows our computer to perform any of the basic arithmetic or bitwise operations on numbers in constant time. In addition, to be especially abstract, let us also assume that our computer is capable of handling numbers of arbitrary size. This is the so-called unit-cost RAM model.

    It turns out that in this case one can sort arbitrarily large numbers in linear time. The method for achieving this (presented in the work of W. Paul and J. Simon, not to be confused with Paul Simon) is completely impractical, yet quite insightful and amusing (in the geeky sense). Let me illustrate it here.

    Paul-and-Simon Sorting

    The easiest way to show an algorithm is to step it through an example. Let us therefore consider the example task of sorting the following array of three numbers:

    a = [5, 3, 9]

    Representing the same numbers in binary:

    [101, 11, 1001]

    Our algorithm starts with a linear pass to find the bit-width of the largest number in the array. In our case the largest number is 9 and has 4 bits:

    bits = max([ceil(log2(x)) for x in a])     # bits = 4
    n = len(a)                                 # n = 3

    Next the algorithm will create a (4+1)\cdot 3^2 = 45-bit number A of the following binary form:

     1 {5} 1 {5} 1 {5} 1 {3} 1 {3} 1 {3} 1 {9} 1 {9} 1 {9}

    where {9}, {3} and {5} denote the 4-bit representations of the corresponding numbers. In simple terms, we need to pack each array element repeated n times together into a single number. It can be computed in linear time using, for example, the following code:

    temp, A = 0, 0
    for x in a:
        temp = (temp<<(n*(bits+1))) + (1<<bits) + x
    for i in range(n):
        A = (A<<(bits+1)) + temp

    The result is 23834505373497, namely:

    101011010110101100111001110011110011100111001

    Next, we need to compute another 45-bit number B, which will also pack all the elements of the array n times, however this time they will be separated by 0-bits and interleaved as follows:

     0 {5} 0 {3} 0 {9} 0 {5} 0 {3} 0 {9} 0 {5} 0 {3} 0 {9}

    This again can be done in linear time:

    temp, B = 0, 0
    for x in a:
        temp = (temp<<(bits+1)) + x
    for i in range(n):
        B = (B<<(n*(bits+1))) + temp

    The result is 5610472248425, namely:

    001010001101001001010001101001001010001101001

    Finally, here comes the magic trick: we subtract B from A. Observe how with this single operation we now actually perform all pairwise subtractions of the numbers in the array:

    A = 1 {5} 1 {5} 1 {5} 1 {3} 1 {3} 1 {3} 1 {9} 1 {9} 1 {9} 
    B = 0 {5} 0 {3} 0 {9} 0 {5} 0 {3} 0 {9} 0 {5} 0 {3} 0 {9}

    Consider what happens to the bits separating all the pairs. If the number on top is greater or equal to the number on the bottom of the pair, the corresponding separating bit on the left will not be carried in the subtraction, and the corresponding bit of the result will be 1. However, whenever the number on the top is less than the number on the bottom, the resulting bit will be zeroed out due to carrying:

    A   = 1 {5} 1 {5} 1 { 5} 1 { 3} 1 {3} 1 { 3} 1 {9} 1 {9} 1 {9} 
    B   = 0 {5} 0 {3} 0 { 9} 0 { 5} 0 {3} 0 { 9} 0 {5} 0 {3} 0 {9}
    A-B = 1 {0} 1 {2} 0 {12} 0 {14} 1 {0} 0 {10} 1 {4} 1 {6} 1 {0}

    The same in binary (highlighted groups correspond to repetitions of the original array elements in the number A):

    A   = 1 0101 1 0101 1 0101|1 0011 1 0011 1 0011|1 1001 1 1001 1 1001
    B   = 0 0101 0 0011 0 1001|0 0101 0 0011 0 1001|0 0101 0 0011 0 1001
    A-B = 1 0000 1 0010 0 1100|0 1110 1 0000 0 1010|1 0100 1 0110 1 0000
    

    Each "separator" bit of A-B is effectively the result of a comparison of every array element with every other. Let us now extract these bits using a bitwise AND and sum them within each group. It takes another couple of linear passes:

    x = A-B >> bits
    mask, result = 0, 0
    for i in range(n):
        mask = (mask<<(n*(bits+1))) + 1
    for i in range(n):
        result += x & mask
        x = x >> (bits+1)

    The result is now the following number:

    result = 10|000000000000001|000000000000011

    It is a packed binary representation of the array r = [2, 1, 3]. The number 2 here tells us that there are two elements in a, which are less or equal than a[0]=5. Similarly, the number 1 says that there is only one element less or equal than a[1]=3, and the number 3 means there are three elements less or equal than a[2]=9. In other words, this is an array of ranks, which tells us how the original array elements should be rearranged into sorted order:

    r = [result >> (n*(bits+1)*(n-i-1)) & ((1<<(n*(bits+1)))-1) 
                                              for i in range(n)]
    a_sorted = [None]*n
    for i in range(n):
        a_sorted[r[i]-1] = a[i]
    

    And voilà, the sorted array! As presented above, the method would only work for arrays consisting of distinct non-negative integers. However, with some modifications it can be adapted to arbitrary arrays of integers or floats. This is left as an exercise to the reader.

    The General Implications

    There are several things one can learn from the "Paul-and-Simon sort". Firstly, it shows the immense power of the unit-cost RAM computational model. By packing arbitrary amounts of data into a single register of unlimited size, we may force our imaginary computer to perform enormously complex parallel computations in a single step. Indeed, it is known that PSPACE-complete problems can be solved in polynomial time in the unlimited-precision RAM model. This, however, assumes that the machine can do arbitrary arithmetic operations. If you limit it to only additions, subtractions and multiplications (but not divisions or bit-shifts), you still cannot sort integers faster than \Omega(n \log n) even using infinitely-sized registers (this is the main result of the Paul and Simon's article that inspired this post). Not obvious, is it?

    Of course, real computers can usually only perform constant-time operations on registers of a fixed size. This is formalized in the w-bit word-RAM model, and in this model the "Paul and Simon sort" degrades from a O(n) into a O(n^3) algorithm (with O(n^2) memory consumption). This is a nice illustration of how the same algorithm can have different complexity based on the chosen execution model.

    The third thing that the "Paul and Simon sort" highlights very clearly is the power of arithmetic operations on packed values and bitstrings. In fact, this idea has been applied to derive practically usable integer sorting algorithms with nearly-linear complexity. The latter paper by Han & Thorup expresses the idea quite well:

    Excerpt from Han & Thorup, "Integer Sorting in O(n sqrt(log log n)) Expected Time and Linear Space".

    In case you need the full code of the step-by-step explanation presented above, here it is.

    Tags: , , ,

  • Posted by Konstantin 09.07.2017 No Comments

    The Dark Side of the Bitcoin

    Recall that Bitcoin is a currency, i.e. it is a technology, which aims to provide a store of value along with a payment medium. With all due respect to its steadily growing adoption, it would be fair to note that it is not very good at fulfilling either of these two functions currently. Firstly, it is not a very reliable store of value due to extreme volatility in the price. Secondly, and most importantly, it is a mediocre payment medium because it is slow and expensive.

    A typical transfer costs around $2 nowadays and takes about an hour for a full confirmation (or longer, if you pay a smaller fee). When you need to transfer a million dollars, this looks like a reasonable deal. When you buy a chocolate bar at a grocery store (something one probably does more often than transferring a million), it is unacceptable. Any plain old bank's payment card would offer a faster and cheaper solution, which is ironic, given that Bitcoin was meant to be all friendly, distributed and free (as in freedom) while banks are, as we all know, evil empires hungry for our money, flesh and souls.

    The irony does not end here. The evil banks typically provide some useful services in exchange for the fees they collect, such as an online self-service portal, 24h support personnel, cash handling and ATMs, some security guarantees, interests on deposits, etc. The friendly Bitcoin offers nothing of this kind. What is Bitcoin wasting our money on then? Electricity, mainly! The Proof of Work (PoW) algorithm employed in the Bitcoin's blockchain requires the computation of quintillions of random, meaningless hashes to "confirm" payments. The "miner" nodes, running the Bitcoin's network are collectively performing more than 5 000 000 000 000 000 000 (five quintillion or five exa-) hash computations every second, continuously consuming as much electricity as the whole country of Turkmenistan. The situation is even worse if you consider that Bitcoin is just one of many other "coins" built upon the PoW algorithm (Ethereum and Litecoin being the two other prominent examples), and their overall power consumption is only growing with each day.

    Just think of it: most of the $2 fee a Bitcoin user needs to pay for a transaction will neither end up as someone's wage nor make a return on investment in someone's pocket. Instead, it will burn up in fossil fuels which generate power for the "miners", wasting precious resources of our planet, contributing to global warming and pushing poor polar bears faster towards extinction. Is all this mayhem at least a "necessary evil"? Sadly, it is not.

    The Unnecessary Evil

    Formally speaking, Proof of Work is an algorithm for achieving consensus among a distributed set of nodes which collectively maintain a common blockchain. Is it the only such algorithm? Of course not! Many alternative methods exist, most of them (if not all) are both faster and less energy-hungry. In fact, the only valuable property of PoW is its ingenious simplicity. In terms of implementation it may very well be among the simplest distributed blockchain consensus algorithms ever to be invented.

    It is natural that a successful pioneering technology (such as the Bitcoin) is originally built from simple blocks. Progress comes in small steps and you cannot innovate on all fronts at once, after all. There must come a time, however, when the limitations of the initially chosen basic blocks become apparent and the technology gets upgraded to something more efficient. With more than $1 billion dollars in electricity bills paid by Bitcoin users last year for the inefficiency of PoW, Bitcoin has long surpassed this turning point, in my opinion.

    Unfortunately, due to its pioneering status, enormous inertia, ongoing hype and the high stakes involved, Bitcoin continues to roll on its old wooden proof-of-work wheels with no improvement in sight, somewhy still being perceived as the leader in the brave new world of cryptocurrencies.

    Are nearly-instant and nearly-free payment along with energy efficiency too much to ask from a real "currency of the future"? I do not think so. In fact, Bitcoin could be such a currency, if only it could switch from the evil Proof of Work to a different, fast and eco-friendly consensus algorithm.

    Which algorithm could it be? Let me offer you an overview of some of the current options I am personally aware of, so you could decide for yourself.

    The Eco-Friendly Blockchain Consensus

    Consider a network of many nodes, which needs to maintain a common state for a chain of blocks. There seem to be roughly three general categories of algorithms which the nodes could employ for their purpose: Proof of Authority (PoA), Nakamoto Consensus, and Byzantine Fault Tolerance (BFT). Let us consider them in order.

    Proof of Authority

    Perhaps the most straightforward solution would be to nominate a fixed subset of nodes as "authoritative", and let any of them append new blocks by signing them cryptographically. To avoid conflicting updates, nodes may agree on a predefined round-robin signing order, honestly randomize their waiting intervals, or use some kind of a deterministic lottery for selecting the signer for next block, etc.

    As this approach relies on a fixed subset of (reasonably) trusted nodes, it does not look robust and secure enough for a proper worldwide distributed blockchain. For example, in the limit case of a single trusted party it is equivalent to using a single service provider such as a bank. None the less, it is a convenient baseline and an important primitive, actually applicable to a wide range of real-life blockchain deployments. By relying on a set of well-behaving parties, a PoA blockchain actually sidesteps most of the complexities of a real distributed algorithm, and can thus be made to perform much faster than any of the "truly distributed" algorithms.

    The Ethereum software provides an implementation of this approach for those who want to run private chains. PeerCoin relies on the PoA principle by having "checkpoint blocks" signed regularly by a trusted authority. Finally, the Delegated Proof of Stake algorithm makes PoA work on a larger scale by relying on voting. It is probably one of the most interesting practical implementations of the idea.

    Delegated Proof of Stake

    Delegated Proof of Stake (DPoS) is a consensus algorithm implemented in Graphene-based blockchains (BitShares, SteemEOS). It is a variant of Proof of Authority, where the small set of authoritative delegate nodes is elected by voting. When electing the delegates, each node can cast the number of votes, proportional to their account value (or "stakeholder share"), thus "delegating their stake in the network". The elected authorities then participate in a simple and fast round-robin block confirmation with each node given a two second window for confirming the next block.

    The security of DPoS hinges on the assumption that the nodes with the most stake in the system should generally manage to elect a set of reasonable authorities, and in case of errors, the misbehaving authorities will not cause too much trouble and will be quickly voted out. At the same time, being internally a PoA implementation, the DPoS-based blockchains are by an order of magnitude faster in terms of transaction throughput than any other currently running public blockchains. Notably, they can also naturally support fee-less transactions.

    Nakamoto Consensus

    Consider the variation of PoA, where there are no pre-selected trusted nodes (i.e. all nodes may participate in the algorithm). Each time a new block needs to be added to the chain, let us pick the node who will gain the right to add it according to some deterministic "lottery" system. The consensus can then be achieved by simply verifying that the resulting blockchain is conforming to the lottery rules at all times, and the conflicting chains are resolved by always preferring the "harder" chain (according to some notion of "hardness").

    For example, the infamous Proof-of-Work is an example of such a method. The "lottery" here is based on the ability of a node to find a suitable nonce value. The "hardness" is simply the length of the chain. Such "lottery" methods are sometimes referred to as "Nakamoto consensus algorithms". In terms of efficiency, Nakamoto consensus algorithms are among the slowest consensus algorithms.

    Several alternatives to the "PoW lottery" have been proposed. Let us review some of them.

    Proof of Stake

    Proof of Stake (PoS), first implemented in the Nxt cryptocurrency, is a Nakamoto consensus technique, where the nodes with a greater balance on their account are given a higher chance to "win the lottery" and sign the next block. The actual technique used in Nxt is the following: before signing a block every node obtains a pseudo-random "lottery ticket number" x by hashing the last block data with its own identifier. If this number is smaller than

        \[\alpha \cdot \text{(account balance)}\cdot \text{(time since last block)},\]

    (where \alpha is a block-specific constant), the node gets the right to sign the next block. The higher the node's balance, the higher is the probability it will get a chance to sign. The rationale is that nodes with larger balances have more at stake, are more motivated to behave honestly, and thus need to be given more opportunities to participate in generating the blockchain.

    Proof of Stake is typically considered as the primary alternative to Proof of Work without all the wasteful computation, and it should, in principle, be possible to transition the whole blockchain from the latter to the former. In fact, this is what may probably happen to Ethereum eventually.

    Proof of Space

    In Proof of Space (PoSpace), a consensus mechanism implemented in Burstcoin, the "miners" must first pre-generate a set of "lottery ticket numbers" in a particular manner for themselves, save these numbers on a hard drive and commit the hash (the Merkle tree root) of this complete ticket set to the blockchain. Then, similarly to Proof of Stake, by hashing the last block's data, a miner deterministically picks one of his own "lottery tickets" for the next block. If the value of this ticket, discounted by the number of tickets in possession, is small enough, the miner gets the right to sign the block. The more tickets a miner generates and stores, the better are his chances. When signing the block, the miner must present a couple of special hashes which he can only know if he constantly stores his complete set of tickets (or fully recomputes a large part of it every time, which is impractical). Consequently, instead of spending energy on the "mining" process, the nodes must constantly dedicate a certain amount of disk space to the algorithm.

    Although it is probably among the less widely known methods, from both technical and practical standpoint, it is one of the most interesting techniques, in my opinion. Note how it combines the properties of PoS (speed and energy efficiency) with those of PoW (ownership of a real-world resource as a proxy for decentralization).

    Proof of Burn

    The idea behind Proof of Burn is to allow the nodes to generate their "lottery ticket numbers" by irretrievably transferring some coins to a nonexistent address and taking the hash of the resulting transaction. The resulting hash, scaled by the amount of coins burned, can then be used to gain the right to sign blocks just like in other Nakamoto lottery systems. The act of wasting coins is meant to be a virtual analogue of spending electricity on PoW mining, without actually spending it. Blockchains based purely on Proof of Burn do not seem to exist at the moment. However, the technique can  be used alongside PoW, PoS or other approaches.

    Proof of Elapsed Time

    Presumably, some Intel processors have specialized instructions for emitting signed tokens, which prove that a given process called a particular function a certain period of time ago. The Hyperledger project proposes to build a consensus algorithm around those. Each "miner" will gain the right to sign a block after it waits for a certain period of time. The token which proves that the miner did in fact wait the allotted time, would act as a winning lottery ticket. I do not see how this method could work outside of the trusted Intel-only environment or how is it better than a trivialized Proof of Stake (not sure I even understood the idea correcty), but I could not help mentioning it here for completeness' sake.

    Hybrid Nakamoto Consensus Systems

    Some systems interleave PoW and PoS confirmations, or add PoA signatures from time to time to lock the chain or speed-up block confirmations. In fact, it is not too hard to invent nearly arbitrary combinations of delegation, voting, payments, authorities and lotteries.

    Byzantine Fault Tolerance

    The Practical Byzantine Fault Tolerance (PBFT) algorithm offers an alternative solution to the consensus problem. Here the blockchain state is tracked by a set of "bookkeeping" nodes, which constantly broadcast all changes among themselves and consider a change reliably replicated when it is signed and confirmed by given quorum (e.g. 2/3) of the bookkeepers. The algorithms of this type can be shown to be reliable if no more than a third of the nodes are dishonest. The Ripple, Stellar and Antshares are examples of blockchains based on such techniques. This algorithm allows much higher transaction throughputs than Nakamoto consensus (PoW, PoS, PoSpace), yet it still lags behind the speed of PoA or DPoS.

    Tags: , , , , ,