This post presumes you are familiar with PCA.
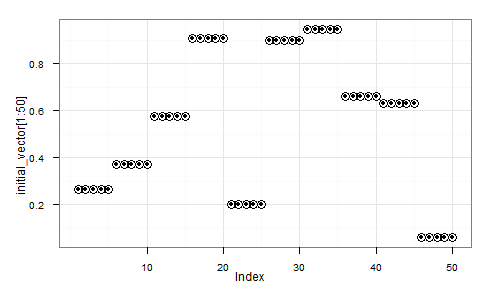
Consider the following experiment. First we generate a random vector (signal) as a sequence of random 5-element repeats. That is, something like
(0.5, 0.5, 0.5, 0.5, 0.5, 0.9, 0.9, 0,9, 0.9, 0,9, 0.2, 0.2, 0.2, 0.2, 0.2, ... etc ... )
In R we could generate it like that:
num_steps = 50
step_length = 5;
initial_vector = c();
for (i in 1:num_steps) {
  initial_vector = c(initial_vector, rep(runif(1), step_length));
}
Here's a visual depiction of a possible resulting vector:
Next, we shall create a dataset, where each element will be a randomly shifted copy of this vector:
library(magic) # Necessary for the shift() function
dataset = c()
for (i in 1:1000) {
  shift_by = floor(runif(1)*num_steps*step_length) # Pick a random shift
  new_instance = shift(initial_vector, shift_by)   # Generate a shifted instance
  dataset = rbind(dataset, new_instance);          # Append to data
}
Finally, let's apply Principal Component Analysis to this dataset:
pca = prcomp(dataset)
Question - how do the top principal components look like? Guess first, then read below for the correct answer.


