When it comes to data analysis, there are hundreds of exciting approaches: simple summary statistics and hypothesis tests, various clustering methods, linear and nonlinear regression or classification techniques, neural networks of various types and depths, decision rules and frequent itemsets, feature extractors and dimension reductors, ensemble methods, bayesian approaches and graphical models, logic-based approaches and fuzzy stuff, ant colonies, genetic algorithms and other optimization methods, monte-carlo algorithms, sampling and density estimation, logic-based and graph methods. Don't even get me started on the numerous visualization techniques.
This sheer number of options is, however, both a blessing and a curse at the same time. In many practical situations just having those methods at your disposal may pose more problems than solutions. First you need to pick one of the approaches that might possibly fit your purpose. Then you will try to adapt it appropriately, spend several iterations torturing the data only to obtain very dubious first results, come to the conclusion that most probably you are doing something wrong, reconvince yourself that you need to try harder in that direction, spend some more iterations testing various parameter settings. Nothing works as you want it to, so you start everything from scratch with another method to find yourself obtaining new, even more dubious results, torturing the data even further, getting tired of that and finally settling on something "intermediately decent", which "probably makes sense", although you are not so sure any more and feel frustrated.
I guess life of a statistician was probably way simpler back in the days when you could run a couple of t-tests, or an F-test from a linear regression and call it a day. In fact, it seems that many experimental (e.g. wetlab) scientists still live in that kind of world, when it comes to analyzing their experimental results. The world of T-tests is cozy and safe. They don't get you frustrated. Unfortunately, t-tests can feel ad-hockish, because they force you to believe that something "is normally distributed". Also, in practice, they are mainly used to confirm the obvious rather than discover something new from the data. A simple scatterplot will most often be better than a t-test as an analysis method. Hence, I am not a big fan of T-tests. However, I do have my own favourite statistical method, which always feels cozy and safe, and never gets me frustrated. I tend to apply it whenever I see a chance. It is the Fisher exact test in the particular context of feature selection.
My appreciation of it stems from my background in bioinformatics and some experience with motif detection in particular. Suppose you have measured the DNA sequences for a bunch of genes. What can you do to learn something new about the sequence structure from that data? One of your best bets is to first group your sequences according to some known criteria. Suppose you know from previous experiments that some of the genes are cancer-related whereas others are not. As soon as you have specified those groups, you can start making observations like the following: "It seems that 10 out of my 20 cancer-related genes have the subsequence GATGAG in their DNA code. The same sequence is present in only 5 out of 100 non-cancer-related ones. How probable would it be to obtain similar counts of GATGAG, if the two groups were picked randomly?" If the probability to get those counts at random is very low, then obviously there is something fishy about GATGAG and cancer - perhaps they are related. To compute this probability you will need to use the hypergeometric distribution, and the resulting test (i.e. the question "how probable is this situation in a random split?") is known as the Fishers' exact test.
This simple logic (with a small addition of a multiple testing correction on top) has worked wonders for finding actually important short sequences on the DNA. Of course it is not limited to sequence search. One of our research group's most popular web tools uses the same approach to discover functional annotations, that are "significantly overrepresented" in a given group of genes. The same approach can be used to construct decision trees, and in pretty much any other "supervised learning" situation, where you have groups of objects and want to find binary features of those objects, associated with the groups.
Although in general the Fisher test is just one particular measure of association, it is, as I noted above, rather "cozy and comfortable". It does not force me to make any weird assumptions, there is no "ad-hoc" aspect to it, it is simple to compute and, most importantly, in my experience it nearly always produces "relevant" results.

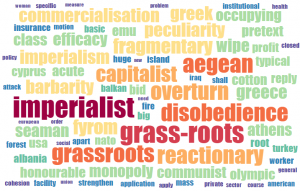
Words overrepresented in the speeches of Greece MPs
A week ago me, Ilya and Alex happened to take part in a small data analysis hackathon, dedicated to the analysis of speech transcripts from the European Parliament. Somewhat analogously to DNA sequences, speeches can be grouped in various ways: you can group them by the speaker who gave them, by country, gender or political party of that speaker, by the month or year when the speech was given or by any combination of such groupings. The obvious "features" of a speech are words, which can be either present or not present in it. Once you view the problem this way the task of finding group-specific words becomes self-evident and the Fisher test is the natural solution to it. We implemented this idea and extracted "country-specific" and "time-specific" words from the speeches (other options were left out due to time constraints). As is usual the case with my favourite method, the obtained results look relevant, informative and, when shown in the form of a word cloud, fun. Check them out.
The complete source code of the analysis scripts and the visualization application is available on Github.


