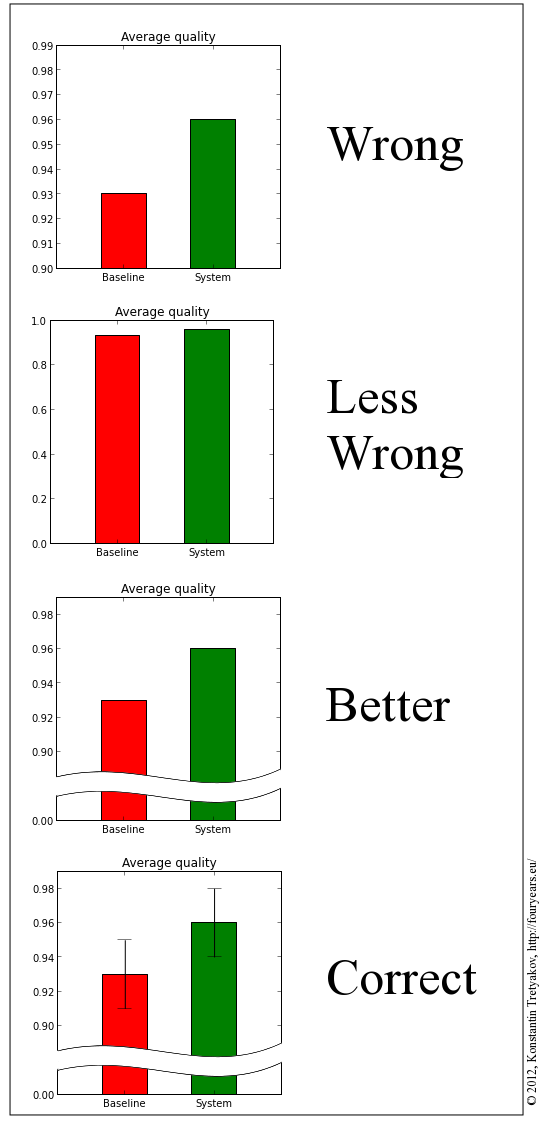
It is annoying how popular it is to ignore the Y-axis limits on bar charts nowadays. Unfortunately, this is also the default mode for most plotting packages, so no one wants to do anything about it. But something must be done.
-
Tags: Data analysis, Project, Visualization
-
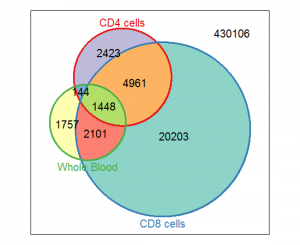
I have recently discovered that simple Venn diagrams are surprisingly popular in bioinformatics. So popular they are, in fact, that there are several bioinformatics research papers devoted solely to their use. And those are highly accessed papers, let me add! Yet, despite this wild popularity, tools that let you render a decent Venn diagram programmatically seem to be rather scarce.
If you google a bit, you will find a bunch of on-line tools of varying degrees of quality and ability (1, 2, 3, 4, 5, 6, 7, 8, 9,...), a Java-based tool, a Perl library, a couple of Python scripts (1, 2), some R libraries (1, 2, 3, 4, 5), and lots of forum discussions. Seems to be plenty, doesn't it? Well, it turns out that if you want your diagram to be area-weighted (i.e. the regions of the diagram should be roughly proportional to the corresponding set sizes), 4 of those 18 links won't do. If you want to generate and configure the diagram conveniently from a script, drop another 9. Then, if you want the diagram to look nice, drop 4 more, and all you are left with is the Vennerable R package. Unfortunately, Vennerable plots are still a pain to configure — even adding a plot title seems to be very tricky, not speaking of highlighting and annotating a region on the diagram.
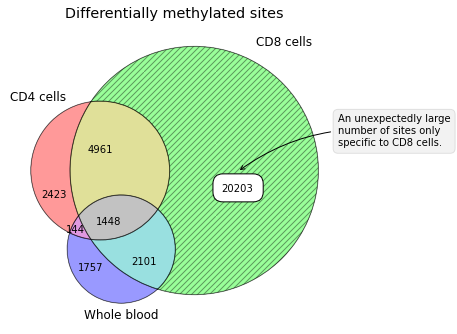
Having been totally disappointed in the state of the art of contemporary Venn-diagramming tools, I made a small Python package for drawing Venn diagrams that has the necessary flexibility. At least it lets me put plot titles and annotate diagram regions as I fancy.
Package installation goes by the standard method:
easy_install matplotlib-vennFor basic usage examples, consult the PyPI page.
Tags: Bioinformatics, Project, Python, Tool, Visualization
Calendar
Recent Comments
Archives
- January 2024 (1)
- October 2019 (1)
- February 2019 (1)
- November 2018 (1)
- June 2018 (1)
- April 2018 (1)
- March 2018 (1)
- December 2017 (1)
- July 2017 (2)
- May 2017 (1)
- March 2017 (4)
- November 2016 (3)
- July 2016 (2)
- May 2016 (1)
- January 2016 (2)
- September 2015 (2)
- July 2015 (1)
- June 2015 (1)
- May 2015 (1)
- April 2015 (3)
- March 2015 (3)
- January 2015 (2)
- March 2014 (2)
- January 2014 (1)
- April 2013 (1)
- February 2013 (2)
- January 2013 (1)
- November 2012 (1)
- October 2012 (2)
- September 2012 (2)
- June 2012 (1)
- May 2012 (1)
- January 2012 (3)
- December 2011 (2)
- October 2011 (3)
- May 2011 (1)
- March 2011 (1)
- June 2010 (1)
- February 2010 (2)
- November 2009 (1)
- October 2009 (3)
- August 2009 (2)
- June 2009 (1)
- March 2009 (3)
- February 2009 (3)
- January 2009 (5)
- December 2008 (4)
- November 2008 (3)
- October 2008 (7)
- September 2008 (8)


