Four Years Remaining

Preparing the consequences
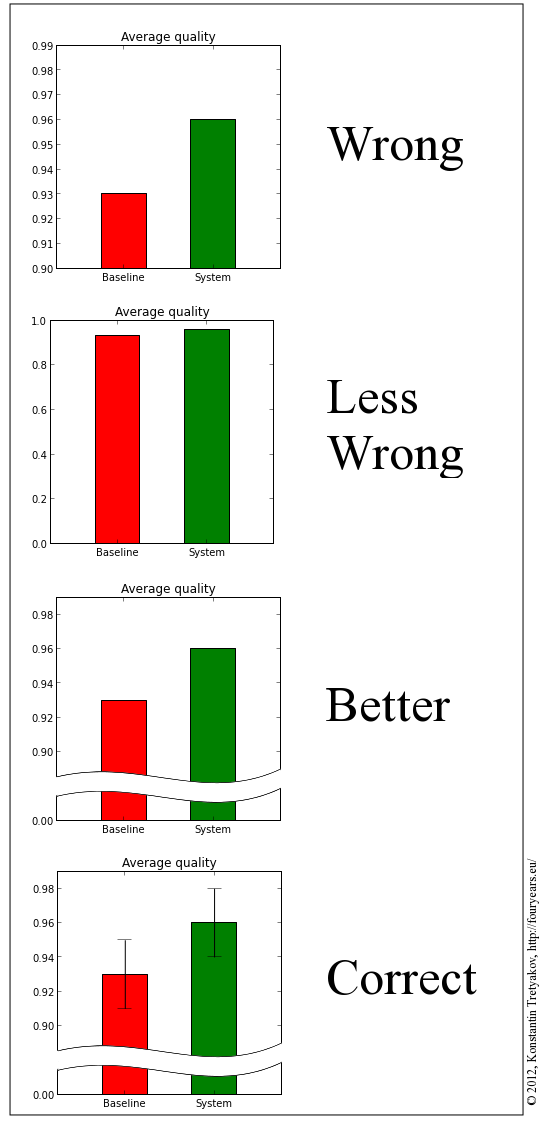
  • A Brief Visual Guide to Bar Charts

    Posted by Konstantin 26.10.2012 4 Comments

    It is annoying how popular it is to ignore the Y-axis limits on bar charts nowadays. Unfortunately, this is also the default mode for most plotting packages, so no one wants to do anything about it. But something must be done.

    Barplots

    Tags: Data analysis, Project, Visualization

Calendar

October 2012
M T W T F S S
« Sep   Nov »
1234567
891011121314
15161718192021
22232425262728
293031  

Recent Comments

  • Oli on The Data Science Workflow
  • Adam on The Curse of Genomic Coordinates
  • second on How to Send an SMS
  • 6 Regularization Techniques for Deep Learning | Python | Keras - AI ASPIRANT on The Mystery of Early Stopping
  • Aldo D'Ottavio on What is the Covariance Matrix?

Archives

  • January 2024 (1)
  • October 2019 (1)
  • February 2019 (1)
  • November 2018 (1)
  • June 2018 (1)
  • April 2018 (1)
  • March 2018 (1)
  • December 2017 (1)
  • July 2017 (2)
  • May 2017 (1)
  • March 2017 (4)
  • November 2016 (3)
  • July 2016 (2)
  • May 2016 (1)
  • January 2016 (2)
  • September 2015 (2)
  • July 2015 (1)
  • June 2015 (1)
  • May 2015 (1)
  • April 2015 (3)
  • March 2015 (3)
  • January 2015 (2)
  • March 2014 (2)
  • January 2014 (1)
  • April 2013 (1)
  • February 2013 (2)
  • January 2013 (1)
  • November 2012 (1)
  • October 2012 (2)
  • September 2012 (2)
  • June 2012 (1)
  • May 2012 (1)
  • January 2012 (3)
  • December 2011 (2)
  • October 2011 (3)
  • May 2011 (1)
  • March 2011 (1)
  • June 2010 (1)
  • February 2010 (2)
  • November 2009 (1)
  • October 2009 (3)
  • August 2009 (2)
  • June 2009 (1)
  • March 2009 (3)
  • February 2009 (3)
  • January 2009 (5)
  • December 2008 (4)
  • November 2008 (3)
  • October 2008 (7)
  • September 2008 (8)
© Konstantin Tretyakov. All Rights Reserved. Entries RSS Comments RSS Open Source