Visualization is a very powerful method for data analysis. Very often, plotting a bunch of scatterplots, barplots, heatmaps, animations or other kinds of imagery is enough to immediately see by your own eyes, whether there are any interesting patterns in the data (which often means you have nearly solved the problem) or not (which means you should prepare yourself for a long-term battle with the data which might not end up succesfully for you).
Visualization is powerful because by visualizing data you essentially "plug it" directly into your brain's processing engine, using the visual interface that happens to be supported by your brain. You need to convert the data into CSV or an XLS format to load it into Excel. Analogously, you need a 2d image or an animation to load the data into your brain - it is that simple.
This view suggests two immediate developments. Firstly, why don't we use the other "interfaces" that our brain has with the outside world for data processing? Could converting data to something which sounds, feels, tastes or smells be a useful method for exploiting our brain's analytic capabilities even further? Obviously, visual input has the most impact simply due to the fact that the retina is an immediate part of the brain. However, auditory signals, for example, seem to have a powerful processing system in our brain dedicated to them too.
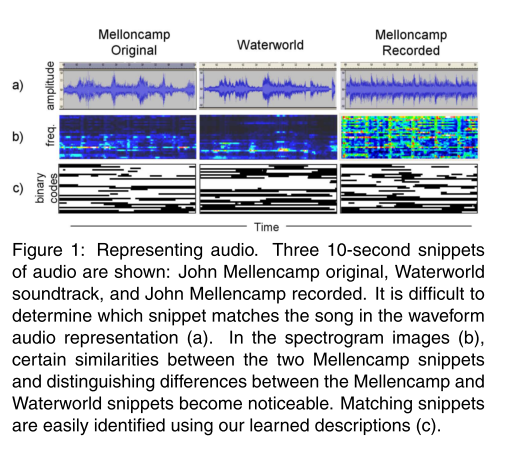
Secondly, if we can appreciate how much our brain is capable of extracting from a single image, why don't we try to automate such an approach? Modern computer vision has reached sufficient maturity to be capable of extracting fairly complex informative features from images. This suggests that a particular 2d plot of a dataset can be used as a kind of an informative "data fingerprint" which, when processed by a computer vision-driven engine, could be analyzed on the presence of "visible" patterns and visual similarity to other datasets.
The fun part is that there has been some research done in this direction. Consider the paper "Computer Vision for Music Identification" by Yan Ke et al. The authors propose to convert pieces of music into a spectrogram image. Those spectrogram images can then be compared to each other using methods of computer vision, thus resulting in an efficient similarity metric, usable for search and identification of musical pieces. The authors claim to achieve 95% precision at 90% recall, which compares favourably to alternative methods. I think it would be exciting to see more of such techniques applied in a wider range of areas.


A year or so ago I applied some compressed sensing facial-recognition algorithms to the problem of recognizing protein 3d structure.
There's a writeup here:
http://www.dirigibleflightcraft.com/prote.cs/
and full source code here:
https://github.com/lynaghk/prote.cs/
if you're interested in this kind of visualization machine learning sort of thing.
Nice Post! Very interesting