• Posted by Konstantin 23.01.2012 2 Comments

    Visualization is a very powerful method for data analysis. Very often, plotting a bunch of scatterplots, barplots, heatmaps, animations or other kinds of imagery is enough to immediately see by your own eyes, whether there are any interesting patterns in the data (which often means you have nearly solved the problem) or not (which means you should prepare yourself for a long-term battle with the data which might not end up succesfully for you).

    Visualization is powerful because by visualizing data you essentially "plug it" directly into your brain's processing engine, using the visual interface that happens to be supported by your brain. You need to convert the data into CSV or an XLS format to load it into Excel. Analogously, you need a 2d image or an animation to load the data into your brain - it is that simple.

    This view suggests two immediate developments. Firstly, why don't we use the other "interfaces" that our brain has with the outside world for data processing? Could converting data to something which sounds, feels, tastes or smells be a useful method for exploiting our brain's analytic capabilities even further? Obviously, visual input has the most impact simply due to the fact that the retina is an immediate part of the brain. However, auditory signals, for example, seem to have a powerful processing system in our brain dedicated to them too.

    Secondly, if we can appreciate how much our brain is capable of extracting from a single image, why don't we try to automate such an approach? ModernĀ computer vision has reached sufficient maturity to be capable of extracting fairly complex informative features from images. This suggests that a particular 2d plot of a dataset can be used as a kind of an informative "data fingerprint" which, when processed by a computer vision-driven engine, could be analyzed on the presence of "visible" patterns and visual similarity to other datasets.

    The fun part is that there has been some research done in this direction. Consider the paper "Computer Vision for Music Identification" by Yan Ke et al. The authors propose to convert pieces of music into a spectrogram image. Those spectrogram images can then be compared to each other using methods of computer vision, thus resulting in an efficient similarity metric, usable for search and identification of musical pieces. The authors claim to achieve 95% precision at 90% recall, which compares favourably to alternative methods. I think it would be exciting to see more of such techniques applied in a wider range of areas.
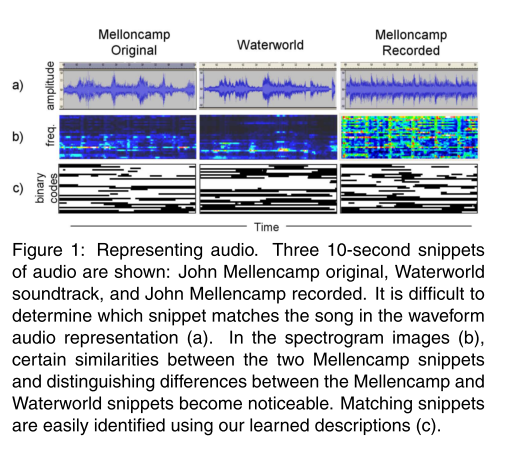
     

    Representing audio as pictures, figure from (Y.Ke, 2005)

    Representing audio as pictures, figure from (Y.Ke, 2005)

    Tags: , , , ,

  • Posted by Konstantin 19.12.2008 3 Comments

    The day before I've accidentally stumbled upon an old textbook on pattern analysis written in Russian (the second edition of a book originally published in 1977, which is more-or-less the time of the classics). A brief review of its contents was enormously enlightening.

    It was both fun and sad to see how smallishly incremental the progress in pattern analysis has been for the last 30 years. If I wasn't told that the book was first published in 1977, I wouldn't be able to tell it from any contemporary textbook. I'm not complaining that the general approaches and techniques haven't changed much, these shouldn't have. What disturbs me is that the vision of the future 30 years ago was not significantly different from what we have today.

    Pattern recognition systems nowadays are getting more and more widespread and it is difficult to name a scientific field or an area of industry where these are not used or won't be used in the nearest future...

    Further on the text briefly describes the application areas for pattern analysis that range from medicine to agriculture to "intellectual fifth-generation computing machines" and robots that were supposed to be here somewhere around nineties already. And although machines did get somewhat more intelligent, we have clearly failed our past expectations. Our current vision of the future is not significantly different from the one we had 30 years ago. It has probably become somewhat more modest, in fact.

    Interesing, is this situation specific to pattern analysis or is it like that in most areas of computer science?

    Tags: , ,

  • Posted by Konstantin 22.10.2008 No Comments

    A beloved child has many names, and so does the field of pattern analysis. Some people call it soft computing, others refer to it as machine learning or data-driven statistics. Although in practice all those terms denote the same approach to data analysis, there is always a certain bias hidden behind each name that relates it to its history and origins. I'm not sure whether I understand these biases correctly, but here's how I would define the terms:

    Pattern Analysis
    This is probably the most general term that refers to a kind of data analysis, where the goal is to find "something interesting" in a given dataset. We typically know what kind of things (patterns) we consider interesting (this might be an association rule, a frequent subsequence, a classifier, etc), and the task is to detect the instances of this kind of patterns. Conceptually somewhat opposite to pattern analysis would be statistical hypothesis testing, where the task is to test a given pattern for interestingness. In this sense pattern analysis is very close to the multiple hypothesis testing statistical problem.
    The simplest way to formalize this generic notion I've seen in this exposition by Tilj de Bie. Let D denote the dataset, let \Pi be the pattern space (e.g. "the space of all sequences", or "the space of all classifiers", etc), and let for each \pi\in\Pi there be a pattern function p_\pi(\cdot), so that p_\pi(D) measures the "interestingness" of this pattern with respect to the data D. Then the general task of pattern analysis is just the following maximization problem:

    \max_{\pi\in\Pi} p_\pi(D)

    Machine Learning
    Machine learning can be regarded as a specific type of pattern analysis, where the central interest lies in finding classifiers or regression functions. The dataset in this case consists of a number of "instances" x_i \in X, and the task is to find a function f: X \to Y that maps these instances to corresponding "outputs" \hat{y}_i = f(x_i) in various ways.
    In the case of supervised machine learning, a "true" output y_i is provided with each instance x_i, and the resulting function should aim to match this output for given instances (i.e. f(x_i) \approx y_i) as well as generalize to the unseen ones. Statisticians call this task regression analysis. A classical example is the problem of detecting incoming spam mail by learning the classification rule from previously labeled messages.
    The task of unsupervised machine learning is to find a classifier f without any prespecified labeling of data. Typically one searches for a function that maps similar inputs to similar outputs. If the set of outputs Y is small and discrete, the task is referred to as clustering and somewhat resembles the problem of quantization. If the outputs are continuous, the task can often be related to either factor analysis or noise reduction.
    Finally, the problem of semi-supervised machine learning is to find a classifier for a dataset where some instances have labels and some don't. This can sometimes be regarded as task of missing value imputation.
    The typical approach to all types of machine learning task usually employs the definition of a loss measure L(f), that estimates the goodness of fit for a given classifier f, and then searching for a classifier that optimizes this measure, i.e.:

    \max_f L(f)

    This defines machine learning as a certain kind of pattern analysis.

    Soft Computing
    If the previous terms denote purely mathematical approaches, for which the exact computational method of obtaining a solution is somewhat irrelevant, then this term, on the contrary, denotes a set of certain metaheuristical computational techniques for obtaining these solutions. In the narrowest sense, by soft computing one might collectively denote the areas of evolutionary algorithms, fuzzy logic and neural networks. This gives soft computing a somewhat ad-hockish flavour: "If you don't know how to solve it, simply put it into a neural network, neural networks just work".

    Data Mining
    This might be just my opinion, but I define data mining as any kind of pattern analysis, that is applied in an offline setting. Moreover, I'd say that, ideally, true data mining happens when you attempt to search for patterns in data that was not initially meant for that specific analysis, thus contradicting the classical statistical ideology "specify your hypothesis first, collect the data later".

    Knowledge Discovery from Databases
    As far as I understand it, KDD is just a YABA and marketingspeak for "data mining", somewhat in the same manner as OLAP and Business Intelligence are marketingspeak for "descriptive statistics".

    Data-Driven Statistics
    In the narrowest sense, data-driven statistics denotes all kinds of nonparametric statistical approaches. These are those methods, where one manages to perform data analysis without specifying any parameterized distributions for the inputs or the like. Typical examples would be the various resampling and randomization techniques. In the broad sense, again, this might very much be the same as pattern analysis in general.

    Any other popular terms for the same thing I've forgotten here?

    Tags: , , , , ,