• Posted by Konstantin 26.02.2009 No Comments

    The first step in the analysis of multivariate data is visualization. Histograms of attribute distributions, scatterplots, box-and-whiskers diagrams, parallel coordinate plots, self organizing maps, and even plots of happy faces - are all means of helping a human to visually comprehend multidimensional data and expoit the enormous power of the human brain to detect patterns. Of all these techniques, two-dimensional scatterplots are perhaps the most popular, as they tend to provide an especially "realistic" feel for the data. But when your data has more than two attributes (perhaps hundreds or thousands), how do you choose the two projection coordinates that would provide you with the "best angle" on the data?

    The easiest answer to that question is, of course, to pick a pair of attributes Ai and Aj, and simply plot one versus the other. Unfortunately, this doesn't usually work well, especially when the dataset does have hundreds of attributes. Therefore, the most popular approach in practice is to use PCA and project the data onto the two largest principal components, which mostly results in a rather insightful image.

    The PCA projection is, however, completely unsupervised. If your data has class labels assigned to points, PCA does not take them into account. No matter what is the labeling, PCA will always produce the same projection onto the coordinates with the highest variation. This might leave an improper impression that the two classes overlap a lot when in fact they do not. Therefore, this is not what you need. Usually, in the case of labeled data you expect from a scatterplot to provide an indication of how separated the two classes are from each other, and how difficult could it be to discriminate between them. It turns out that it is very easy to construct a linear projection with such properties.

    The Linear classifier-based Scatterplot

    Assume there are two classes in the data and we are interested in a linear projection, that demonstrates how separated the classes are. Let us train a linear classifier to discriminate the two classes. It does not matter which algorithm you use, as long as it results in a separating hyperplane. Now naturally, the normal to this hyperplane is the main coordinate of interest to you: it is the direction along which the data will be classified linearly by your algorithm. If there is a coordinate for demonstrating separation, this must be it. The choice of the second projection coordinate does not matter much, so I would propose picking any direction orthogonal to the first.

    When you have three classes you could select the first projection coordinate as the normal of a hyperplane, separating the first class from the second, and the second coordinate as the normal of a hyperplane, separating the first class from the third.

    Finally, note that in general you need not limit yourself to linear classifiers only. Any classifier of the form y_i = \mathrm{sign}(f(x_i)) will provide you with an informative coordinate projection function f(x). This is a natural "supervised" alternative to kernel-PCA or SOM.

    Naive supervised linear scatterplot (NS-plot)

    To be somewhat more specific, here's a suggestion of a very simple implementation for the abovementioned idea. To avoid the use of a potentially complicated linear classifier training algorithm, let us just pick the vector connecting the means of the two classes as the first projection coordinate. The second coordinate is chosen at random and then orthogonalized with the first one. The Scilab code of the whole algorithm is therefore the following:

      // Input:
      //   X - the data matrix (instances in rows, attributes in columns)
      //   C - class assignments (C(i) is the class of instance X(i,:))
      mean_1 = mean(X(C ==  1, :), 'r')';
      mean_2 = mean(X(C == -1, :), 'r')';
      v1 = (mean_2 - mean_1)/norm(mean_2 - mean_1);
      v2 = rand(v1);
      v2 = v2 - v2'*v1*v1;
      v2 = v2/norm(v2);
      X_proj = X*[v1 v2];
      // Output:
      //   X_proj - the projected coordinates

    Notice how much simpler and more efficient it is than PCA. Despite the simplicity, I haven't seen the use of such a plot anywhere else, so let me coin the boring name NS-plot for it. Personal experience shows that the resulting plot is visually never much worse than a PCA plot, and most often the two plots complement each other. Let me illustrate that on two simple examples.

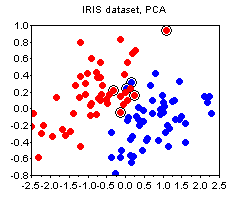
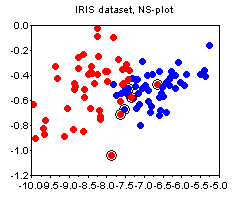
    The IRIS dataset. The plots below show the PCA and the NS plots of the famous iris dataset (where I removed the first class). There is clearly no strong advantage of one plot over the other except that PCA is more difficult to compute.
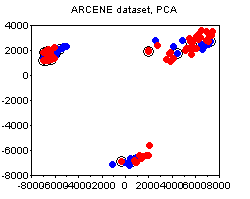
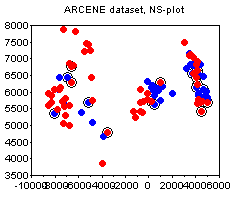
    The ARCENE dataset. The following plots depict the 1000-attribute ARCENE sample dataset. We can see how PCA prefers to stress the unsupervised clustering present in the dataset, thus potentially deemphasizing the specifics of class labeling. In this case, I would say, the PCA and the NS plots complement each other.
    Bonus

    Noticed the circled points on the plots above? This is one other small trick that I find quite useful, and that does not seem to be widely known. The circled points denote the "boundary" - these are the points whose nearest neighbor is of a different class than their own. The more boundary points there are - the more difficult is the classification problem. The boundary is not an absolute notion, because there are various ways to define distance between points. My suggestion would be to standardize all attributes and use the euclidean norm, unless you have good reasons to do something else (e.g. you a-priori know good weights for the attributes, etc).

    Tags: ,

  • Posted by Konstantin 19.02.2009 6 Comments

    Everyone, who flies reasonably often has a chance to observe a remarkable effect: no matter how steep the roll angle of an airliner is during a turn, the tea in your cup will always stay parallel to the floor, and not to the ground. In the course of one recent unexpectedly long discussion on this topic, it turned out there is no much easily googleable material out there to refer to. I thought I'd create some, hence a somewhat longer post on an otherwise simple matter of minor relevance to my main affairs.

    So, firstly, why doesn't tea orient itself parallel to the ground? To understand that, consider a pair of insightful examples. They should rid you of the incorrect intuitive assumption that it is gravity, which plays a defining role in the orientation of your tea.

    The bucket experiment

    Example 1: Water in the bucket

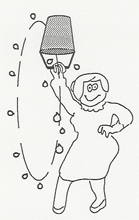
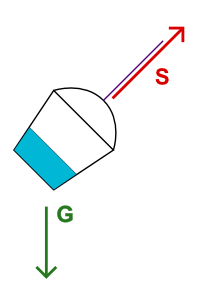
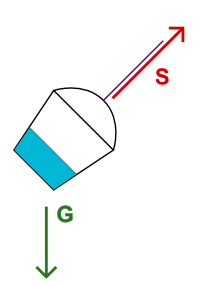
    Consider the experiment described in the previous post about a water bucket on a string. No matter what you do with the bucket, as long as the string is at strain, the water will stay parallel to bottom of the bucket, and not to the ground. The explanation for that is the following. Water is affected by gravity G. The bucket is affected by gravity G and the strain of the string S. Therefore, from the frame of reference of the bucket, water experiences force G-(G+S) = -S, which pulls it towards the bottom of the bucket.

    Example 2: Paragliders

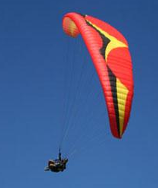
    A paraglider

    You have probably seen paragliders in the air. If not, just search for "extreme paragliding" on youtube. Note that whatever the angle of the wing, the person is always hanging perpendicularly to it. Now if you'd hand him a bottle with water, the water would, naturally, also orient itself in parallel to the wing. The reason of that behaviour is the same as in the water bucket experiment, with the lift of the wing playing the same role as the strain of the string.

    The main idea of both examples is that as long as the container and the object inside it are equally affected by gravity, it is not gravity that orients the object with respect to the container. More precisely, for the water to incline to the side, there must be some force acting on the container from that side.

    The Airplane: A Simple Model
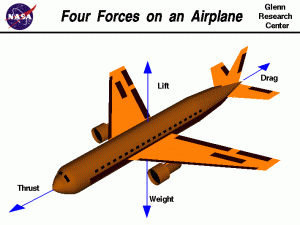
    Let us now consider an idealized airplane. According to a popular model, an airplane in flight is affected by four forces: the thrust of the engines T, the drag due to air resistance D, the lift of the wings L and the gravitational weight of the airplane G. The glass of tea inside the airplane is, of course, only affected by gravity G. By applying the same logic as before, we can easily compute, that in the frame of reference of the airplane, the tea is experiencing acceleration F = G-(T+D+L+G) = -(T+D+L).

    However, once the airplane has attained constant speed (which is true for most of the duration of the flight), its thrust is completely cancelled by the air resistance, i.e. T+D = 0, in which case F = -L. It now remains to note that the lift force of the wings is always approximately perpendicular to the wings and thus to the floor of the airliner. The tea in your cup must therefore indeed be parallel to the floor.

    The Airplane: A More Realistic Model
    The model considered in the previous section is somewhat too simplistic. According to it there are no forces acting on the sides of the airplane whatsoever, and it should therefore be absolutely impossible to incline the tea in the cup to the side, which is, of course, not true for a real airplane. So, assuming a pilot would want to incline the tea and spill it, what would be his options?

    1. Thrust. As noted above, tea must only be parallel to the floor when thrust is perfectly cancelled by drag and the plane is moving with constant speed. A rapid increase or decrease in thrust could therefore incline the tea towards or against the direction of flight. But of course, there is usually no need for such a maneuver during a passenger flight except for takeoff and landing.
    2. Rotation. The model above does not consider the fact, that the pilot may use the ailerons and rudder to turn the airplane, rotating it around its axes. And of course, when the resulting rotation is abrupt enough, the tea could incline somewhat. However, during passenger flights the turns are always performed very smoothly, with rotation speeds around 1 degree per second. In fact it is risky, if not impossible to perform any hasty rotationary maneuvers on an airliner travelling at about 800km/h.
    3. Turn with a skid

      Turn with a skid

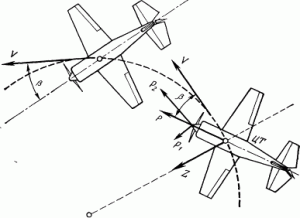
      Slip. The simple model above considered the case when the air is flowing directly along the main axis of the airplane, which need not necessarily always be the case. The condition may be violated either due to a strong sidewind, or during a peculiar kind of a turn, where the airplane "slips" or "skids" on the side. In both cases, the airflow is exerting pressure on the side of the airplane's hull, which generates the so-called body lift. It is usually incomparably smaller than the lift of the wings, but nonetheless, it can incline the water to the side.
      It is interesting to understand why you should almost never experience slip in an airliner. There are two reasons for that. Firstly, most airplanes have a degree of weathercock stability. Like a weathercock, an airplane with a vertical tail stabilizer tends to automatically orient itself into the direction of airflow and thus avoid slip. This effect is especially strong at the speed of a commercial airliner.
      Secondly, if the weathercock effect is not enough to prevent slip, the pilot himself will always ensure that the slip is never too large by watching the slip-indicator (aka inclinometer) and coordinating the turn.
      Why that? Because the airplane is not constructed, aerodynamically, to fly sideways. When the plane is moving sideways, the body of the plane blocks airflow over the trailing wing. So the wing loses lift and begins to drop. This naturally will put the airplane into a bank in the direction of the turn, but it does so at great cost in drag. When the slip is too large the lifting properties of the wings change so drastically that this might put the airplane at the risk of a crash.

    Summary
    Q: Why is the tea in an airliner parallel to the floor even when the airplane is turning?
    A: It follows from the following three conditions, that must all be satisfied for a safe flight:

    1. The forces of thrust and drag cancel each other and the airplane moves at a constant speed.
    2. The turns are performed smoothly.
    3. There is no slip: the air flows directly along the main axis of the airplane.

    Tags: , ,

  • Posted by Konstantin 12.02.2009 3 Comments
    Bucket swing experiment

    Most of us probably remember this experiment from high school physics lessons: you take a bucket on a string filled with water, spin it around your head and the water does not spill. "But how?" - you would ask in amazement. And the teacher would explain then:
    "You see, the bucket is spinning, and this creates the so-called centrifugal force acting on the water, which cancels out gravity and thus keeps the water in the bucket". And you will have a hard time finding any other explanation. At least I failed no matter how hard I googled it.

    Unfortunately, this explanation looses an essential point of the experiment and I have seen people irreparaply braindamaged by the blind belief that it is only due to rotation and the resulting virtual centrifugal force that the water does not spill.

    However, it is not quite the case. Let us imagine that the bucket has accidentally stopped right over your head and as a result, all centrifugal force has been immediately lost. Would the water spill? It will certainly fall down on your head, but it will do so together with the bucket. Thus, technically, the water will stay inside the bucket.

    In fact, the proper way to enjoy the true magic of the experiment is not to swing the bucket in full circles, but rather let it swing back and forth as a pendulum (if you have a string and a beverage bottle nearby, you can do an experiment right now). One will then observe that even at the highest points of the swing, where the bottom of the bucket is at its steepest angle and the centrifugal force is nonexistant, the water stays strictly parallel to the bottom of the bucket, as if no gravity would act upon it. Why doesn't it spill? Clearly, the argument of centrifugal force cancelling gravity is inappropriate.

    Forces

    The proper explanation is actually quite simple and much more generic. We have two objects here: the bucket and the water in it. There is one (real) force acting on the water: gravity G. There are two (real) forces acting on the bucket: gravity G and the strain S of the string pulling the bucket perpendicularly to its bottom. (Note that the centrifugal force is not "real" and I do not consider it here, but if you wish, you may. Just remember then that it acts both on the water and the bucket.)
    Now the question of interest is, how does water behave with respect to the bucket? That is, what force "pulls" the water towards the bucket and vice-versa. This can be easily computed by subtracting all forces acting on the bucket from all forces acting on the water. And the result is, of course, G - (S+G) = -S, i.e. a force, pulling the water directly towards the bottom of the bucket.

    A magical consequence of this argument is that gravity does not matter inside the bucket, as long as it can act on the bucket freely in the same way as on anything inside it. Nothing special about rotation here, really. It takes a while to realize.

    Tags: , , ,

  • Posted by Konstantin 28.01.2009 5 Comments

    Imagine that you have just derived a novel IQ test. You have established that for a given person the test produces a normally-distributed unbiased estimate of her IQ with variance 102. That is, if, for example, a person has true IQ=120, the test will result in a value from a N(120,102) distribution. Also, from your previous experiments you know that among all the people, IQ has a N(110,152) distribution.

    One a sunny Monday morning you went out on a street and requested the first bypasser (whose name turned out to be John) to take your test. The resulting score was t=125. The question is: what can you conclude now about the true IQ of that person (assuming, of course, that there is such a thing as a "true IQ"). There are at least two reasonable approaches to this problem.

    1. You could apply the method of maximum likelihood. Here's John, standing beside you, and you know his true IQ must be some real number a. The test produced an unbiased estimate of a equal to 125. The likelihood of the data (i.e. the probability of obtaining a test score of 125 for a given a) is therefore:

          \[P[T=125|A=a]=\frac{1}{\sqrt{2\pi 10^2}}\exp\left(-\frac{1}{2}\frac{(125-a)^2}{10^2}\right)\]

      The maximum likelihood method suggests picking the value of a that maximizes the above expression. Finding the maximum is rather easy here and it turns out to be at a=125, which is pretty natural. You thus conclude that the best what you can say about John's true IQ is that it is approximately 125.

    2. An alternative way of thinking is to use the method of maximum a-posteriori probability, where instead of maximizing likelihood P[T=125|A=a], you maximize the a-posteriori probability P[A=a|T=125]. The corresponding expression is:

       \begin{multiline} P[A=a|T=125] \sim P[T=125|A=a]\cdot P[A=a] = \\ = \frac{1}{\sqrt{2\pi 10^2}}\exp\left(-\frac{1}{2}\frac{(125-a)^2}{10^2}\right)\cdot \frac{1}{\sqrt{2\pi 15^2}}\exp\left(-\frac{1}{2}\frac{(110-a)^2}{15^2}\right) \end{multiline}

      Finding the required maximum is easy again, and the solution turns out to be a=120.38. Therefore, by this logic, John's IQ should be considered to be somewhat lower than what the test indicates.

    Which of the two approaches is better? It might seem utterly unbelievable, but the estimate provided by the second method is, in fact, closer to the truth. The straightforward "125", proposed to by the first method is biased, in the sense that on average this estimate is slightly exaggerated. Think how especially unintuitive this result is from the point of view of John himself. Clearly, his own "true IQ" is something fixed. Why on Earth should he consider "other people" and take into account the overall IQ distribution just to interpret his own result obtained from an unbiased test?

    To finally confuse things, let us say that John got unhappy with the result and returned to you to perform a second test. Although it is probably impossible to perform any real IQ test twice and get independent results, let us imagine that your test can indeed be repeated. The second test, again, resulted in a score of 125. What IQ estimate would you suggest now? On one hand, John himself came to you and this time you could regard his IQ as a "real" constant, right? But on the other hand, John is just a person randomly picked from the street, who happened to take your test twice. Go figure.

    PS: Some additional remarks are appropriate here:

    • Although I'm not a fan of The Great Frequentist-Bayesian War, I cannot but note that the answer is probably easier if John is a Bayesian at heart, because in this case it is natural for him to regard "unknown constants" as probability distributions and consider prior information in making inferences.
    • If it is hard for you to accept the logic in the presented situation (as it is for me), some reflection on the similar, but less complicated false positive paradox might help to relieve your mind.
    • In general, the correct way to obtain the true unbiased estimate is to compute the mean over the posterior distribution:

          \[E[a|T=125] = \int a \mathrm{dP}[a|T=125]\]

      In our case, however, the posterior is symmetric and therefore the mean coincides with the maximum. Computing the mean by direct integration would be much more complicated.

    Tags: , , , ,

  • Posted by Konstantin 22.01.2009 2 Comments

    I bet most of you haven't heard of MDX, because it seems to be a technology that is difficult to stumble upon. It is not covered in university courses, not mentioned in the headlines of PC-magazine articles, and the corresponding google search returns about 20000 results, which makes it thousands (and even tens of millions) times less popular than most other related keywords. This is completely unfair. I believe MDX is compulsory knowledge for everyone who is educated in databases and data analysis enough to appreciate the virtues of both SQL queries and Excel-like spreadsheet processing. A famous quote by Alan Perlis says: "A language that doesn't affect the way you think about programming, is not worth knowing". In these terms, MDX is a language well worth knowing.

    MDX stands for Multidimensional Expressions. It is a language for specifying computations and performing queries on a multidimensional database, which effectively provides the computing power of spreadsheets in the form of a query language. Although it is not possible to explain all of MDX in a blog post, I'll try to show the gist of it in a couple of examples. I hope it will raise at least some interest in those, who are patient enough to read to the end. To understand MDX you need some experience with spreadsheets, so I'll assume you do and use the analogies with Excel.

    Multidimensional data. You use spreadsheets to work with tabular data, i.e. something like that:

    Tartu Tallinn
    Jan 21 -1.0 °C -2.1 °C
    Jan 22 -0.2 °C -0.2 °C
    Jan 23 0.3 °C -0.2 °C
    Average temperature

    This is a two-dimensional grid of numbers. Each point in the grid can be indexed by a tuple (Date, City). A multidimensional database is essentially the same grid but without the limitation of two dimensions. For instance, if there are several methods of measuring temperature, you can add a new dimension and index each cell by a tuple (Date, City, MeasurementMethod). And if you wish to keep both the average temperature and humidity, you just add a fourth dimension MeasureType to the database and store both, etc. Once your database becomes multidimensional it becomes impossible to display all of it as a two-dimensional table, so you will have to explore it by slices. For example, if the database did indeed contain 4 dimensions (Date, City, MeasurementMethod, MeasureType) then the above table would be a slice of it for (MeasureType = Temperature, MeasurementMethod = Usual). The MDX query corresponding to the slice would look as follows:

      select
        { City.Tartu, City.Tallinn } on columns,
        { Date.Jan.21, Date.Jan.22, Date.Jan.23 } on rows
      where (MeasureType.Temperature, MeasurementMethod.Usual)

    Cell calculations. The second thing you use spreadsheets for is to compute new cell values from the existing ones. For example, you might wish to augment the table above with a column showing the temperature difference between Tartu and Tallinn and a row showing the average temperature over three days:

    Tartu Tallinn Difference
    Jan 21 -1.0 °C -2.1 °C 1.1 °C
    Jan 22 -0.2 °C -0.2 °C 0.0 °C
    Jan 23 0.3 °C -0.2 °C 0.5 °C
    Average -0.3 °C -0.83 °C 0.53 °C
    Average temperature

    To do that in Excel you would have to enter a formula for each cell in the new column and row. In MDX you analogously write:

      create member City.Difference as (City.Tartu - City.Tallinn)
      create member Date.Jan.Average as 
             (Avg({ Date.Jan.21, Date.Jan.22, Date.Jan.23 }))

    Note that once you have defined the new members, they apply to any slice of your data. I.e., you have just defined the way to compute City.Difference and Date.Jan.Average for all existing measure types and measurement methods. Moreover, many of the useful aggregate computations are already predefined for you. For example, the MDX server would implicitly understand that Date.Jan denotes be the aggregation (e.g. average) of values over all the days of January, and Date is the aggregation of values over all the dates ever. Similarly, City denotes the aggregation over all cities. Thus, selecting the average temperature over all cities in January is a matter of requesting

      select
      where (Date.Jan, City, MeasureType.Temperature, 
             MeasurementMethod.Usual)

    Filters, orders and more. You often need to query the data for things like "cities with the highest average temperature in January", or request to "order days by the temperature difference between Tartu and Tallinn". This is where both the power and complexity of MDX becomes visible. The first query would look as follows:

      select
        Filter(City.Members, Date.Jan == Max(Date.Jan)) on columns
      where (MeasureType.Temperature, MeasurementMethod.Usual)

    Notice how much more expressive this is in comparison to the equivalent query you would have to come up with in SQL. Besides slicing, filtering and ordering, an MDX server can support lots of various generic data processing and analysis functions (here, the exact capabilities depend on the vendor). Thus, when properly tuned, even the tasks such as "selecting differentially expressed genes that play a significant role in a linear model for predicting cancer stage from microarray expression data" could become a matter of a single concise query.

    Pretty cool, don't you think?

    Tags: , , , , ,

  • Posted by Konstantin 15.01.2009 21 Comments

    Consider the following excerpt from a recent article in the British Medical Journal:

    Puzzle

    Mike has only two children, and they are called Pat and Alex, which could equally be boys’ or girls’ names. In fact, Pat is a girl. What is the probability that Alex is a boy?

    a 50%
    b Slightly less than 50%
    c Slightly more than 50%
    d Between 60% and 70%
    e Between 40% and 30%

    d—Although this could be about the relative popularity of ambiguous names for boys and girls or about subtle imbalances in the sex ratio, it is not meant to be. The clue to the correct answer is in thinking about what we do not know about the family and what we do know already, and applying this to the expected probabilities of girls and boys.

    We do not know if Pat was born first or second. We do know that there are only two children and that Pat is a girl. I am assuming that in the population, 50% of children are girls.

    The birth order and relative frequency of two child families are: boy, boy (25%), girl, girl (25%), boy, girl (25%) girl, boy (25%). We know Mike’s family does not have two boys, since Pat is a girl, so we are only left with three choices for families with at least one girl. Two of these pairs have a boy and one does not. Hence the probability that Alex is a boy is two thirds or 66.7%.

    If we had been told that Pat was born first then the probability that Alex is a boy drops to 50%.

    The well-known "Boy or Girl" paradox that is referenced in the fragment above is probably as old as the probability theory itself. And it is therefore quite amusing to see an incorrect explanation for it presented in a serious journal article. You are welcome to figure out the mistake yourself.

    For completeness sake, here is my favourite way of presenting this puzzle:

    In the following, let Mike be a randomly chosen father of two kids.

    1. Mike has two kids, one of them is a boy. What is the probability that the other one is a girl?
    2. Mike has two kids, the elder one is a boy. What is the probability that the other one is a girl?
    3. Mike has two kids. One of them is a boy named John. What is the probability that the other one is a girl?
    4. I came to visit Mike. One of his two kids, a boy, opened the door to me. What is the probability that Mike's other child is a girl?
    5. I have a brother. What is the probability that I am a girl?
    6. I have a brother named John. What is the probability that I am a girl?

    You can assume that boys and girls are equiprobable, the births of two kids are independent events, a randomly chosen boy will be named John with probability p, and that a family may have two kids with the same name.

    If you haven't tried solving these yet, give it a try. I'm pretty sure you won't do all 6 questions correctly on the first shot.

    Tags: , , ,

  • Posted by Konstantin 01.01.2009 2 Comments
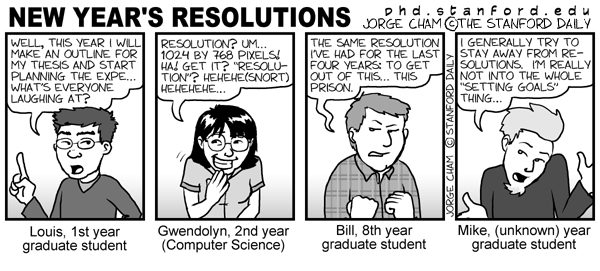
    PhD comic: New Year's Resolutions
    1. Submit at least 2 papers.
    2. Attend at least 2 significant conferences (ICML and ISMB, hopefully).
    3. Make at least 2 important acquaintances.
    4. Participate as a reviewer at least twice.
    5. Write at least 2 pieces of software (useful to at least 2 people each).
    6. Read at least 2 non-technical books and at least 2 technical books.
    7. Complete at least 2 of these multiple side-projects that eagerly wait for completion.
    8. Supervise at least 22 students to successful defence.
    9. Keep this blog running (26 blog entries or so).
    10. Keep in touch with friends and relatives, have a fair dose of fun, sports, music and all the rest that belongs here (you go windsurfing, you call me, OK?).

    Did I miss something?

    Tags:

  • Posted by Konstantin 25.12.2008 1 Comment

    A long time ago, information was stored and transmitted by people who passed it in the form of poems from mouth to mouth, generation to generation, until, at some moment, writing was invented. Some poems were lucky enough to be carefully written down in letters on the scrolls of papyrus or pergament, yet a considerable number of them was left unwritten and thus lost. Because in the age of writing, an unwritten poem is a non-existent poem. Later on came the printing press and brought a similar revolution: some books from the past were diligently reprinted in thousands of copies and thus preserved for the future. The remaining ones were effectively lost, because in the age of the printing press, an unpublished book is a nonexistent book. And then came the Internet. Once again, although a lot of the past knowledge has migrated here, a large amount hasn't, which means that is has been lost for most practical purposes. Because in the age of the Internet, if it is not in the Internet, it does not exist. The tendency is especially notable in science, because science is essentially about accumulating knowledge.

    The effect of such regular "cleanups" (and I am sure these will continue regularly for as long as humankind exists) is twofold. On one hand, the existing knowledge is reviewed and only the worthy pieces get a chance to be converted into the new media format. As a result, a lot of useless crap is thrown away in an act of natural selection. On the other hand, a considerable amount of valuable information gets lost too, simply because it seemed useless at that specific moment. Of course, it will be reinvented sooner or later anyway, but the fact that it was right here and we just lost it seems disturbing, doesn't it.

    I'm still browsing through that old textbook from the previous post and enjoying the somewhat unfamiliar way the material is presented. Bayesian learning, boolean logic and context-free-grammars are collected together and related to decision theory. If I did not know the publication date of the book, I could easily mistake this "old" way of presenting the topic, for being something new. Moreover, I guess that, with an addition of a minor twist, some ideas from the book could probably be republished in a low-impact journal and thus recognized as "novel". It would be close to impossible to figure out the copy, because a pre-Internet-era non-English text simply does not exist.

    Tags: , ,

  • Posted by Konstantin 19.12.2008 3 Comments

    The day before I've accidentally stumbled upon an old textbook on pattern analysis written in Russian (the second edition of a book originally published in 1977, which is more-or-less the time of the classics). A brief review of its contents was enormously enlightening.

    It was both fun and sad to see how smallishly incremental the progress in pattern analysis has been for the last 30 years. If I wasn't told that the book was first published in 1977, I wouldn't be able to tell it from any contemporary textbook. I'm not complaining that the general approaches and techniques haven't changed much, these shouldn't have. What disturbs me is that the vision of the future 30 years ago was not significantly different from what we have today.

    Pattern recognition systems nowadays are getting more and more widespread and it is difficult to name a scientific field or an area of industry where these are not used or won't be used in the nearest future...

    Further on the text briefly describes the application areas for pattern analysis that range from medicine to agriculture to "intellectual fifth-generation computing machines" and robots that were supposed to be here somewhere around nineties already. And although machines did get somewhat more intelligent, we have clearly failed our past expectations. Our current vision of the future is not significantly different from the one we had 30 years ago. It has probably become somewhat more modest, in fact.

    Interesing, is this situation specific to pattern analysis or is it like that in most areas of computer science?

    Tags: , ,

  • Posted by Konstantin 13.12.2008 No Comments

    It is somewhat sad to see that the Scalable Vector Graphics (SVG) format, despite its considerable age and maturity, has not yet gained too much popularity in the internet, with a lot of Adobe Flash all over instead. Here are some points you should know about it, so that maybe you consider taking a couple of hours to get acquainted with it one day.

    1. SVG is an open source vector graphics format.
    2. SVG supports most of what you'd expect from a 2D graphics language: cubic splines, bezier curves, gradients, nested matrix transformations, reusable symbols, etc.
    3. SVG is XML-based and rather straightforward. If you need a picture with a line and two circles, you write a <line> tag and two <circle> tags:
      <svg xmlns="http://www.w3.org/2000/svg">
          <line x1="0" y1="0" x2="100" y2="100" 
                stroke-width="2" stroke="black"/>
          <circle cx="0" cy="0" r="50"/>
          <circle cx="100" cy="100" r="20" 
                  fill="red" stroke="black"/>
      </svg>
    4. Most vector graphics editors can write SVG. For example, Inkscape is one rather usable open-source software piece.
    5. SVG supports Javascript. Basically, if you know HTML and Javascript, you are ready to write SVG by hand, because SVG is also just XML + Javascript. This provides considerable freedom of expression.
    6. SVG can be conveniently embedded into HTML webpages and is supported out-of-the-box by most modern browsers.

    My personal interest towards SVG is related to the observation, that it seems very suitable for creating interactive data visualizations (charts, plots, graphs) right in the browser. And although the existing codebase devoted to these tasks can't be called just enormous, I'm sure it will grow and gain wider adoption. Don't miss it!

    Tags: , , , ,