• Posted by Konstantin 25.02.2013 9 Comments

    Most of bioinformatics revolves, in one way or another, around the genome. Even in the largely "non-genomic" areas, such as systems biologyproteomics, or metabolomics, the key players are still genes, proteins, and their regulatory regions, which can be associated with particular points on the genome. Consequently, no matter what kind of data you work with, if you do bioinformatics, you will sooner or later have to deal with genomic coordinates.

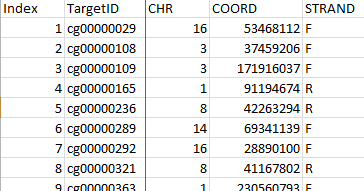
    To interpret genomic coordinates you need to know the reference genome version and coordinate conventions used. Does the data file mention those?

    To interpret genomic coordinates you need to know the reference genome version and coordinate conventions used. Does the data file mention those?

    Surprisingly, despite being of such central importance to bioinformatics, the whole genomic coordinate business seems to be in a rather unfriendly state nowadays. Firstly, there are several ways to refer to genomic positions (e.g. 0-based vs 1-based indexing), and for every possible combination of conventions, there is at least one file format that will be using it. Then, of course, you have to deal with several versions of the reference genome, and, to make your life harder yet, most data files will not tell you what genome version should be used to interpret the coordinates stored there. Finally, if you decide that you need to unify the coordinates among your different data files by converting them to the same reference genome version, you will find out that your only tools here are a couple of heavyweight web apps and a command-line UCSC liftOver utility. Should you look for R or Python libraries to script your task, you will discover that those do no smarter than forward all the conversion tasks to that same liftOver.

    I found this is all to be extremely wrong and hacked up a tiny Python tool recently, which will happily convert your coordinates without the need to invoke an external liftOver process. It does not fully replace liftOver (yet?), as it does not convert regions - a task just a bit more tricky than lifting over single points. However it lets you do single-point conversion in the simplest way possible:

    from pyliftover import LiftOver
    lo = LiftOver('hg17', 'hg18')
    lo.convert_coordinate('chr1', 1000000, '-') # 0-based indexing

    As usual, install via: easy_install pyliftover (or pip install pyliftover)

    For more information consult the PyPI page.

    Tags: , , , ,

  • Posted by Konstantin 26.10.2012 4 Comments

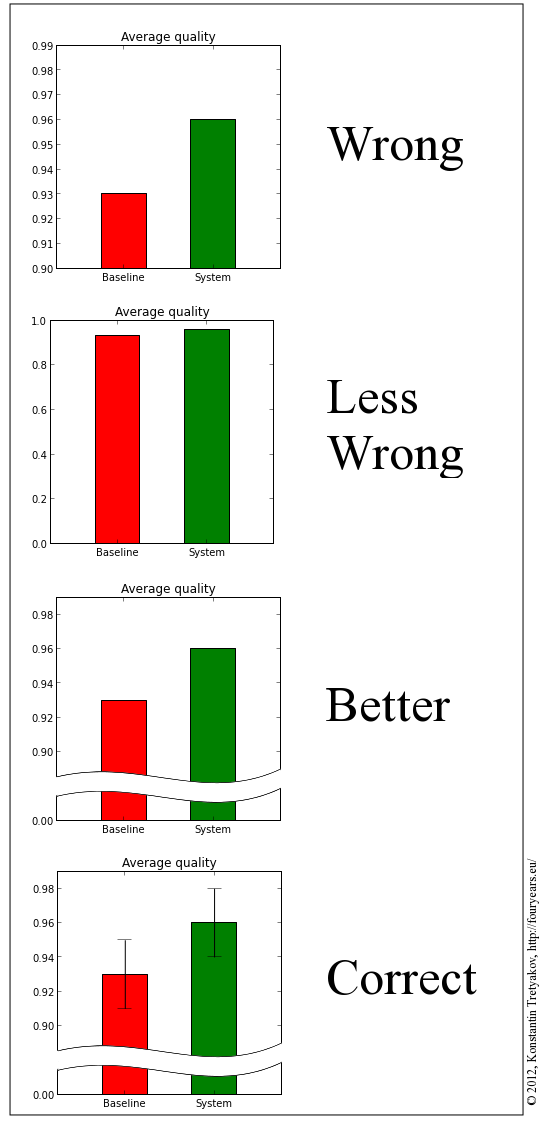
    It is annoying how popular it is to ignore the Y-axis limits on bar charts nowadays. Unfortunately, this is also the default mode for most plotting packages, so no one wants to do anything about it. But something must be done.

    Barplots

    Tags: , ,

  • Posted by Konstantin 13.10.2012 38 Comments

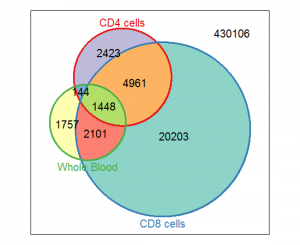
    I have recently discovered that simple Venn diagrams are surprisingly popular in bioinformatics. So popular they are, in fact, that there are several bioinformatics research papers devoted solely to their use. And those are highly accessed papers, let me add! Yet, despite this wild popularity, tools that let you render a decent Venn diagram programmatically seem to be rather scarce.

    Vennerable plot

    Vennerable plot

    If you google a bit, you will find a bunch of on-line tools of varying degrees of quality and ability (1, 2, 3, 4, 5, 6, 7, 8, 9,...), a Java-based tool,  a Perl library, a couple of Python scripts (1, 2), some R libraries (1, 2, 3, 4, 5), and lots of forum discussions. Seems to be plenty, doesn't it? Well, it turns out that if you want your diagram to be area-weighted (i.e. the regions of the diagram should be roughly proportional to the corresponding set sizes), 4 of those 18 links won't do. If you want to generate and configure the diagram conveniently from a script, drop another 9. Then, if you want the diagram to look nice, drop 4 more, and all you are left with is the Vennerable R package. Unfortunately, Vennerable plots are still a pain to configure — even adding a plot title seems to be very tricky, not speaking of highlighting and annotating a region on the diagram.

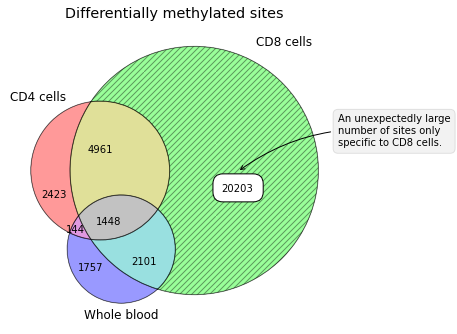
    Having been totally disappointed in the state of the art of contemporary Venn-diagramming tools, I made a small Python package for drawing Venn diagrams that has the necessary flexibility. At least it lets me put plot titles and annotate diagram regions as I fancy.


    Matplotlib-venn plot

    Matplotlib-venn plot


    Package installation goes by the standard method: easy_install matplotlib-venn

    For basic usage examples, consult the PyPI page.

    Tags: , , , ,

  • Posted by Konstantin 23.01.2012 2 Comments

    Visualization is a very powerful method for data analysis. Very often, plotting a bunch of scatterplots, barplots, heatmaps, animations or other kinds of imagery is enough to immediately see by your own eyes, whether there are any interesting patterns in the data (which often means you have nearly solved the problem) or not (which means you should prepare yourself for a long-term battle with the data which might not end up succesfully for you).

    Visualization is powerful because by visualizing data you essentially "plug it" directly into your brain's processing engine, using the visual interface that happens to be supported by your brain. You need to convert the data into CSV or an XLS format to load it into Excel. Analogously, you need a 2d image or an animation to load the data into your brain - it is that simple.

    This view suggests two immediate developments. Firstly, why don't we use the other "interfaces" that our brain has with the outside world for data processing? Could converting data to something which sounds, feels, tastes or smells be a useful method for exploiting our brain's analytic capabilities even further? Obviously, visual input has the most impact simply due to the fact that the retina is an immediate part of the brain. However, auditory signals, for example, seem to have a powerful processing system in our brain dedicated to them too.

    Secondly, if we can appreciate how much our brain is capable of extracting from a single image, why don't we try to automate such an approach? Modern computer vision has reached sufficient maturity to be capable of extracting fairly complex informative features from images. This suggests that a particular 2d plot of a dataset can be used as a kind of an informative "data fingerprint" which, when processed by a computer vision-driven engine, could be analyzed on the presence of "visible" patterns and visual similarity to other datasets.

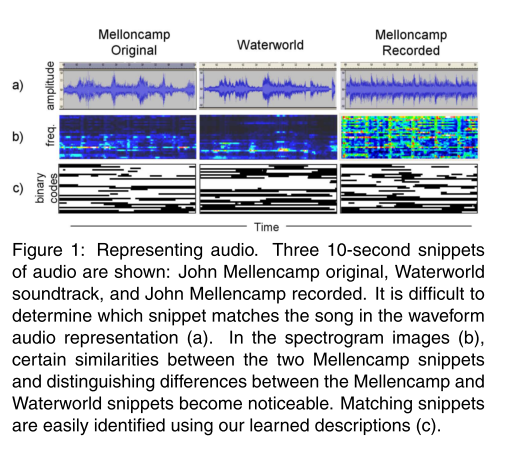
    The fun part is that there has been some research done in this direction. Consider the paper "Computer Vision for Music Identification" by Yan Ke et al. The authors propose to convert pieces of music into a spectrogram image. Those spectrogram images can then be compared to each other using methods of computer vision, thus resulting in an efficient similarity metric, usable for search and identification of musical pieces. The authors claim to achieve 95% precision at 90% recall, which compares favourably to alternative methods. I think it would be exciting to see more of such techniques applied in a wider range of areas.


    Representing audio as pictures, figure from (Y.Ke, 2005)

    Representing audio as pictures, figure from (Y.Ke, 2005)

    Tags: , , , ,

  • Posted by Konstantin 22.10.2011 No Comments

    This year I have been lucky to be taking part in the Robotex robot-building course. Despite being an awful time-sink, it is also uniquely enlightening. Our team has a blog, documenting the progress. If you think you might be interested to see what does "making a small robot" mean, and what kind of problems may come on the way, do take a peek:

    http://robotex.ing.ee/

    Tags: , ,

  • Posted by Konstantin 09.05.2011 2 Comments

    I have recently realized that my HP 8440p laptop has a built-in "Qualcomm un2420 Broadband Module" device, also known as a "3G modem". For some reason no drivers were preinstalled for it on my system, and with the SIM card slot concealed behind the battery, it was not something I noticed immediately. Once the drivers were installed, the operating system had no problem recognizing the new "Mobile Broadband Connection" opportunity, and with the SIM card in the slot, I could connect to the Internet via 3G, yay.

    Knowing that there is more to mobile communication than Internet access, I was wondering whether I could do anything else, like voice calls or SMS. Unfortunately, my attempts of finding any reasonable software packages, which would open up the power of 3G to me at the click of a button, failed. Instead, however, I discovered that it is actually quite easy to communicate with the modem directly. It turns out you can control your shiny bleeding-edge 3.5G device by sending plain old AT commands to it over a serial port. This is the same protocol that the wired grandpa-modems have been speaking since the 70s and it is fun to see this language was kept along all the way into the wireless century.

    Let me show you how it works. Try to follow along — this is kinda fun.

    Finding your Modem

    If your computer does not have a built-in 3G modem, chances are high your garden variety cellphone does (not to mention smartphones, of course). If it is the case, then:

    • Switch on the Bluetooth receiver on your phone (for older Nokias this is usually in the "Settings -> Connectivity -> Bluetooth" menu).
    • On your computer, go to "Devices and Printers", click "Add a device", wait until your phone appears on the list, double click it and follow the instructions to establish the connection. (I'm talking about Windows 7 here, but the procedure should be similar for most modern OSs).
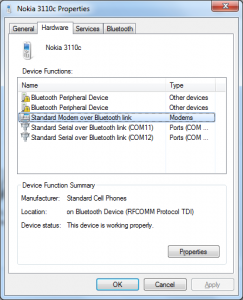
    • Once the computer recognizes your phone and installs the necessary drivers, it will appear as an icon in the "Devices" window. Double click it to open the "Properties" window, and make sure there is a "Standard Modem over Bluetooth link" function or something similar in the list.

      Cellphone Functions

      Cellphone Functions

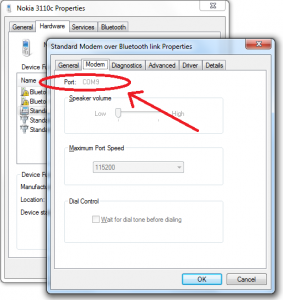
    • Double-click that "modem" entry, a new properties window opens. Browse along in it, and find the COM port number that was assigned to the modem.

      Bluetooth modem at port COM9

      Bluetooth modem at port COM9

    If you do have a 3G modem bundled with your laptop (and you have the drivers installed), open the Device manager ("Control Panel -> Device Manager"), find the modem in the list, double click to open the "Properties" page, and browse to the "Modem" tab to find the COM port number.

    Laptop 3G modem in Device Manager

    Laptop 3G modem in Device Manager

    Connecting to the Modem

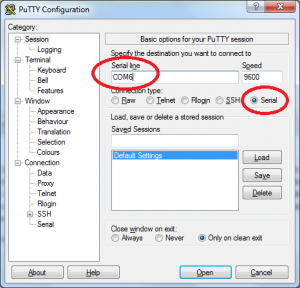
    Next thing - connect to the COM port. In Windows use PuTTY to do it. In Linux use minicom. Don't worry about the settings — the defaults should do.

    PuTTY connection dialog

    PuTTY connection dialog

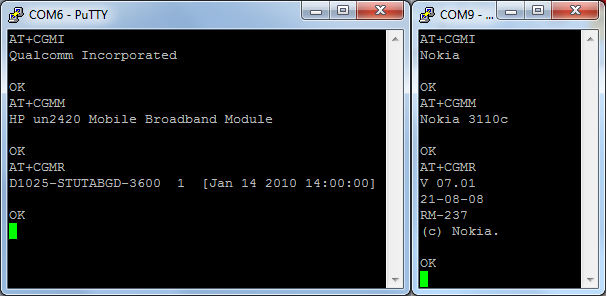
    Once the connection starts, you will get a blank screen with nothing but a cursor. Try typing "AT+CGMI" followed by a <RETURN>. Note that, depending on the settings of your device and the terminal program, you might not see your letters being typed. If so, you will have to reconfigure the terminal (enable "local echo"). But for now, just type the command. You should get the name of the manufacturer in response. You can also get the word "ERROR" instead. This means that your modem is ready to talk to you, but it either does not support the "AT+CGMI" command OR requires you to enter the PIN code first. We'll get to it in a second. If you get no response at all, you must have connected to the wrong COM port.

    Terminal sessions with a Qualcomm (left) and Nokia (right) 3G modems

    Terminal sessions with a Qualcomm (left) and Nokia (right) 3G modems

    You can get more information about the device using the "AT+CGMM", "AT+CGMR", "AT+CGSN" commands. Try those.

    Authentication

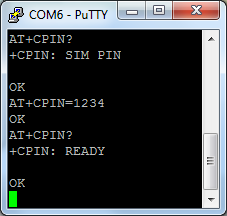
    To do anything useful, you need to authenticate yourself by entering the PIN (if you use your cellphone over bluetooth, you most probably already entered it and no additional authentication is needed). You can check whether you need to enter PIN by using the command "AT+CPIN?" (note the question mark). If the response is "+CPIN: READY", your SIM card is already unlocked. Otherwise the response will probably be "+CPIN: SIM PIN", indicating that a PIN is expected to unlock the card. You enter the pin using the "AT+CPIN=<your pin>" command. Please note, that if you enter incorrect PIN three times, YOUR SIM CARD WILL BE BLOCKED (and you will have to go fetch your PUK code to unblock it), so be careful here.

    Entering the PIN

    Entering the PIN

    Doing Stuff

    Now the fun starts: you can try dialing, sending and receiving messages and do whatever the device lets you do. The (nonexhaustive) list of most interesting commands is available here. Not all of them will be supported by your device, though. For example, I found out that the laptop's 3G modem won't let me dial numbers, whilst this was not a problem for a cellphone connected over bluetooth (try the command "ATD<your number>;" (e.g. "ATD5550010;")). On the other hand, the 3G modem lets me list received messages using the "AT+CMGL" command, while the phone refused to do it.

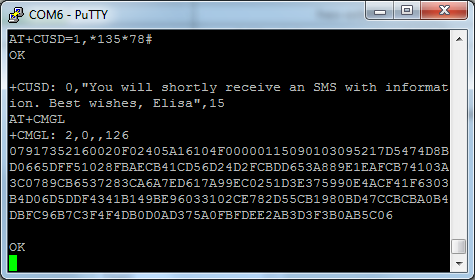
    One useful command to know about is "AT+CUSD", which lets you send USSD messages (those "*1337#" codes) to the mobile service provider. For example, the prepaid SIM card I bought for my computer allows to buy a "daily internet ticket" (unlimited high-speed internet for 12 hours for 1 euro) via the "*135*78#" code. Here's how this can be done via terminal.

    Sending an USSD code and receiving an SMS

    Sending an USSD code and receiving an SMS

    We first send "AT+CUSD=1,*135*78#" command, which is equivalent to dialing "*135*78#" on the phone. The modem immediately shows us the operator's response ("You will shortly receive an SMS with information..."). We then list new SMS messages using the "AT+CMGL" command. There is one message, which is presented to us in the PDU encoding. A short visit to the online PDU decoder lets us decrypt the message - it simply says that the ticket is activated. Nice.

    Sending an SMS

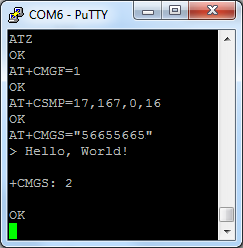
    Finally, here's how you can send a "flash" SMS (i.e. the one which does not get saved at the receiver's phone by default and can thus easily confuse people. Try sending one of those at night - good fun). We start with an ATZ to reset the modem, just in case. Then we set message format to "text mode" using the "AT+CMGF=1" command (the alternative default is the "PDU mode", in which we would have to type SMS messages encoded in PDU). Then we set message parameters using the "AT+CSMP" command (the last 16 is responsible for the message being 'flash'). Finally, we start sending the message using the "AT+CMGS=<phone number>" command. We finish typing the message using <Ctrl+Z> and off it goes.

    Sending a "Flash" SMS

    Sending a "Flash" SMS

    For more details, refer to this tutorial or the corresponding specifications.

    All in all, it should be fairly easy to make a simple end-user interface for operating the 3G modem, it is strange that there is not much free software available which could provide this functionality. If you find one or decide to make one yourself, tell me.

    Tags: , , , ,

  • Posted by Konstantin 19.06.2010 1 Comment

    The other day I was working on a Python program, which internally used a data structure for holding a set of rules. Each rule specified how some object was created from some other objects through certain procedures. The corresponding set of rules could be represented as a bunch of assignment expressions:

    # Description of the relations between objects
    some_item[1].sub_item = some_proc(other_item[2], "Text", 42)
    some_item[2].sub_item = other_proc(some_item[1], "Text", 1337)
    # ... etc

    I would manually describe the required structure using code like the following (in fact, it was slightly more complicated than that, but I hope you get the point).

    struct = Structure()
    struct.add_relation(['some_item', '[1]', '.sub_item'], 
                     ['some_proc', ['other_item', '[2]'], '"Text"', '42'])
    struct.add_relation(['some_item', '[2]', '.sub_item'],
                     ['other_proc', ['some_item', '[1]'], '"Text"', '1337'])
    now_do_something_with(struct)

    After having specified the required rules I would process them and thus solve my task, the details of which are not important here. What is important, is that all those struct.add_relation lines looked messy, long and ugly, and begged for a more concise syntax.

    One obvious choice would be to write the expressions down as strings and parse them within add_relation using ast.parse:

    struct = Structure()
    struct.add_relation(
      'some_item[1].sub_item = some_proc(other_item[2], "Text", 42)')
    struct.add_relation(
      'some_item[2].sub_item = other_proc(some_item[1], "Text", 1337)')
    now_do_something_with(struct)

    Multiple variations on this idea are possible (for example, the whole description could go in a separate configuration file), but in any case this is not a very "easy" solution.

    What I am going to show you here is that appropriate use of Python's dynamic features makes it possible to have the structure defined using Python code, side-by-side with normal Python code, in the following manner:

    @structure_definition
    def struct():
       some_item[1].sub_item = some_proc(other_item[2], "Text", 42)
       some_item[2].sub_item = other_proc(some_item[1], "Text", 1337)
    
    now_do_something_with(struct)

    This post aims to explain the mechanics behind such a solution.

    Part I: __getattr__ and __setattr__

    The first step is fairly easy. As you should know, Python is fairly flexible in that it allows you to redefine any operator, including attribute access, function invocation and assignments. We can therefore create a class StructureCreator, which does redefine all those operators as needed, and then use it in the following manner:

    s = StructureCreator()
    s.some_item[1].sub_item = s.some_proc(s.other_item[2], "Text", 42)
    s.some_item[2].sub_item = s.other_proc(s.some_item[1], "Text", 1337)

    To see what we need to do to make it work, let us explicitly write out what happens here on line 2. This line is equivalent to the following expression:

    s.__getattr__('some_item')
     .__getitem__(1)
     .__setattr__('sub_item', 
       s.__getattr__('some_proc')
        .__call__(s.__getattr__('other_item').__getitem__(2), "Text", 42)
     )

    This invocation structure neatly corresponds to the parse tree of the original expression and our StructureCreator class should therefore simply collect the information from the invocations, recursively building data structures describing the left- and right-hand sides of the expression. Finally, at the time the assignment operator __setattr__ is invoked, the collected information about the assignment can be saved appropriately. Here is an abridged conceptual example:

    class StructureBuilder:
      def __init__(self, expr=''):
        self.__dict__['__expr__'] = expr
    
      def __str__(self):
        return self.__expr__
      __repr__ = __str__
      
      def __getattr__(self, attrname):
        newname = self.__expr__ + '.' + attrname
        return StructureBuilder(newname)
    
      def __setattr__(self, attrname, val):
        newname = self.__expr__ + '.' + attrname
        print 'Saving: %s = %s' % (newname, str(val))   
    
    s = StructureBuilder()
    s.x = s.y

    It remains to implement __getitem__, __setitem__ and __call__ in a similar manner, and voila, you are all covered in syntax sugar.

    The fact that you will have to prefix all your "custom" expressions with this annoying s. might still bug your aesthetical feelings. If so, follow me to the next step.

    Part II: Hiding the Builder

    In the previous part we figured out how, by using __getattr__ and __setattr__ we can make Python interpret assignments our way. In order for it to work, however, we need to explicitly refer to an object which implements those methods, and write lines like

    s.x = s.y

    Can we somehow "hide" this object and have something analogous to automatic __getattr__ for global scope? Yes we can: Python conveniently provides us with a construction:

    exec [code] in [environment]

    which would execute our code, using the provided dictionary to resolve variables.

    Let us try it. We modify our StructureBuilder to inherit from dict and add the methods __getitem__ and __setitem__ which will happily resolve and assign to arbitrary variable names:

    class StructureBuilder(dict):
      def __init__(self, expr=''):
        self.__dict__['__expr__'] = expr
    
      def __str__(self):
        return self.__expr__
      __repr__ = __str__
      
      def __getattr__(self, attrname):
        newname = self.__expr__ + '.' + attrname
        return StructureBuilder(newname)
    
      def __setattr__(self, attrname, val):
        newname = self.__expr__ + '.' + attrname
        print 'Saving: %s = %s' % (newname, str(val))   
    
      def __getitem__(self, itemname):
        newname = self.__expr__ + '.' + str(itemname)
        return StructureBuilder(newname)
    
      def __setitem__(self, itemname, val):
        newname = self.__expr__ + '.' + str(itemname)
        print 'Saving: %s = %s' % (newname, str(val))
    

    Does it work?

    s = StructureBuilder()
    exec 'x[1].y = z' in s

    It does, but now we are providing Python code in a string, which is not at all sexy. Let us try the following instead:

    def definition():
      x[1].y = z
    
    exec definition.func_code in s

    Bummer. NameError: global name 'z' is not defined.. But why? Isn't that exactly the same as the previous attempt with a string?

    Part III: Lexical Scoping

    There is a difference in how Python compiles code in a string and in a function. To see that, let us take a look at what's inside the compiled snippets for a string

    s = 'x = y'

    and a function

    def f():
      x = y

    To do that let us use Python's bytecode disassembler module dis:

    import dis
    # First snippet (code in a string)
    dis.dis(compile(s, '', 'exec'))
    # Second snippet (code in a function)
    dis.dis(f.func_code)

    Here is the output for two snippets side by side:

    Snippet1 (String)                Snippet2 (Function)
    -------------------------------------------------------
    0 LOAD_NAME      0 (y)           0 LOAD_GLOBAL    0 (y)
    3 STORE_NAME     1 (x)           3 STORE_FAST     0 (x)
    6 LOAD_CONST     0 (None)        6 LOAD_CONST     0 (None)
    9 RETURN_VALUE                   9 RETURN_VALUE 

    Now we see it - the snippet from the string uses the LOAD_NAME and SAVE_NAME commands to access the variables, which neatly proxy the requests to our dictionary, as we want them to.

    The snippet from the function behaves in a different way. Firstly, the variable x is accessed using STORE_FAST, which is a command used for local variables. This command would not use the provided dictionary because the variable x has been determined as local to the function's scope and assigned its own memory location within the function's frame at compilation. Secondly, the variable y is accessed via LOAD_GLOBAL which, in Python's terms, refers to a variable from a surrounding lexical scope, not the dynamic scope we are trying to enforce. In short, this command also does not care about the dictionary that we provided.

    Does it mean that it is impossible to overcome the scoping rules that Python uses when compiling a function? Of course not - all we need is to modify the bytecode, replacing each LOAD_FAST, STORE_FAST, LOAD_GLOBAL and STORE_GLOBAL with LOAD_NAME and STORE_NAME.

    Part IV: Bytecode

    The required modification is well documented here, but let me give you a brief overview.
    The bytecode for a Python function f is stored in its field f.func_code.co_code. It is a sequence of bytes, which is easy to parse into opcodes. Every opcode is one byte long. Opcodes with a byte-value greater or equal than opcode.HAVE_ARGUMENT are followed by a two-byte argument. This does not seem to be well documented, but is easily read out from the code of the dis.dis function, which comes with Python. For completeness' sake, here's how a simple bytecode parser might look like:

    def bytecode(code_obj):
    	import opcode
    	code = code_obj.co_code
    	n = len(code)
    	i = 0
    	while i < n:
    		op = ord(code[i])
    		i += 1
    		oparg = None
    		if op >= opcode.HAVE_ARGUMENT:
    			oparg = ord(code[i]) + ord(code[i+1])*256
    			i += 2
    		yield (op, oparg)
    

    We now need to take the code object of our function, replace the ***_FAST and ***_GLOBAL commands with ***_NAME and create a new code object. Leaving out some details, this goes as follows:

    def as_anonymous_block(func):
      new_bytecode = []
      for (op, arg) in bytecode(func.func_code):
        if (op in [STORE_FAST, LOAD_FAST, STORE_GLOBAL, LOAD_GLOBAL]):
          new_op = LOAD_NAME or STORE_NAME, correspondingly
          new_arg = for ***_FAST we need to modify this value
          new_bytecode.append(new_op, new_arg)
        else:
          new_bytecode.append(op, arg)
      return types.CodeType( ... options, flags ... , new_bytecode)
    

    Once we perform this modification on our function object, we can use exec ... in ... to have our StructureBuilder take control of the assignments within the function:

    def definition():
      x[1].y = z
     
    exec as_anonymous_block(definition) in s
    

    Part V: Putting It All Together

    As I promised in the beginning of this post, it is possible to encapsulate the whole thing into a function annotation @structure_definition and use it as follows:

    @structure_definition
    def struct():
       some_item[1].sub_item = some_proc(other_item[2], "Text", 42)
       some_item[2].sub_item = other_proc(some_item[1], "Text", 1337)
    
    now_do_something_with(struct)

    The last step is therefore creating the @structure_definition annotation, which is rather straightforward. For a given function it processes it using as_anonymous_block, creates a new StructureBuilder object, executes the function's code in the StructureBuilder, and returns the result:

    def structure_definition(f):
      blk = as_anonymous_block(f)
      result = StructureBuilder()
      exec blk in result
      return result
    

    For further details refer to (a slightly more elaborate) example code here.

    To conclude, I should note that in my case I still ended up using the solution from Step I (i.e. the one where "dynamic" variables are prefixed with s.), because it allows to use loop variables and other constructs alongside my structure definitions much more naturally than the second method. Nonetheless, I hope you enjoyed the presented exploration as much as I did.

    Tags: , , , ,

  • Posted by Konstantin 22.01.2009 2 Comments

    I bet most of you haven't heard of MDX, because it seems to be a technology that is difficult to stumble upon. It is not covered in university courses, not mentioned in the headlines of PC-magazine articles, and the corresponding google search returns about 20000 results, which makes it thousands (and even tens of millions) times less popular than most other related keywords. This is completely unfair. I believe MDX is compulsory knowledge for everyone who is educated in databases and data analysis enough to appreciate the virtues of both SQL queries and Excel-like spreadsheet processing. A famous quote by Alan Perlis says: "A language that doesn't affect the way you think about programming, is not worth knowing". In these terms, MDX is a language well worth knowing.

    MDX stands for Multidimensional Expressions. It is a language for specifying computations and performing queries on a multidimensional database, which effectively provides the computing power of spreadsheets in the form of a query language. Although it is not possible to explain all of MDX in a blog post, I'll try to show the gist of it in a couple of examples. I hope it will raise at least some interest in those, who are patient enough to read to the end. To understand MDX you need some experience with spreadsheets, so I'll assume you do and use the analogies with Excel.

    Multidimensional data. You use spreadsheets to work with tabular data, i.e. something like that:

    Tartu Tallinn
    Jan 21 -1.0 °C -2.1 °C
    Jan 22 -0.2 °C -0.2 °C
    Jan 23 0.3 °C -0.2 °C
    Average temperature

    This is a two-dimensional grid of numbers. Each point in the grid can be indexed by a tuple (Date, City). A multidimensional database is essentially the same grid but without the limitation of two dimensions. For instance, if there are several methods of measuring temperature, you can add a new dimension and index each cell by a tuple (Date, City, MeasurementMethod). And if you wish to keep both the average temperature and humidity, you just add a fourth dimension MeasureType to the database and store both, etc. Once your database becomes multidimensional it becomes impossible to display all of it as a two-dimensional table, so you will have to explore it by slices. For example, if the database did indeed contain 4 dimensions (Date, City, MeasurementMethod, MeasureType) then the above table would be a slice of it for (MeasureType = Temperature, MeasurementMethod = Usual). The MDX query corresponding to the slice would look as follows:

      select
        { City.Tartu, City.Tallinn } on columns,
        { Date.Jan.21, Date.Jan.22, Date.Jan.23 } on rows
      where (MeasureType.Temperature, MeasurementMethod.Usual)

    Cell calculations. The second thing you use spreadsheets for is to compute new cell values from the existing ones. For example, you might wish to augment the table above with a column showing the temperature difference between Tartu and Tallinn and a row showing the average temperature over three days:

    Tartu Tallinn Difference
    Jan 21 -1.0 °C -2.1 °C 1.1 °C
    Jan 22 -0.2 °C -0.2 °C 0.0 °C
    Jan 23 0.3 °C -0.2 °C 0.5 °C
    Average -0.3 °C -0.83 °C 0.53 °C
    Average temperature

    To do that in Excel you would have to enter a formula for each cell in the new column and row. In MDX you analogously write:

      create member City.Difference as (City.Tartu - City.Tallinn)
      create member Date.Jan.Average as 
             (Avg({ Date.Jan.21, Date.Jan.22, Date.Jan.23 }))

    Note that once you have defined the new members, they apply to any slice of your data. I.e., you have just defined the way to compute City.Difference and Date.Jan.Average for all existing measure types and measurement methods. Moreover, many of the useful aggregate computations are already predefined for you. For example, the MDX server would implicitly understand that Date.Jan denotes be the aggregation (e.g. average) of values over all the days of January, and Date is the aggregation of values over all the dates ever. Similarly, City denotes the aggregation over all cities. Thus, selecting the average temperature over all cities in January is a matter of requesting

      select
      where (Date.Jan, City, MeasureType.Temperature, 
             MeasurementMethod.Usual)

    Filters, orders and more. You often need to query the data for things like "cities with the highest average temperature in January", or request to "order days by the temperature difference between Tartu and Tallinn". This is where both the power and complexity of MDX becomes visible. The first query would look as follows:

      select
        Filter(City.Members, Date.Jan == Max(Date.Jan)) on columns
      where (MeasureType.Temperature, MeasurementMethod.Usual)

    Notice how much more expressive this is in comparison to the equivalent query you would have to come up with in SQL. Besides slicing, filtering and ordering, an MDX server can support lots of various generic data processing and analysis functions (here, the exact capabilities depend on the vendor). Thus, when properly tuned, even the tasks such as "selecting differentially expressed genes that play a significant role in a linear model for predicting cancer stage from microarray expression data" could become a matter of a single concise query.

    Pretty cool, don't you think?

    Tags: , , , , ,

  • Posted by Konstantin 24.10.2008 No Comments

    This week I had a chance to participate in a project meeting related to soft computing. A part of the meeting was a brainstorm-like session, dedicated to the generation of relevant topics for future research in the field. I was listening very carefully, writing everything down, and trying to generalize somewhat. By the end of the meeting my generalization attempts succeeded and now I can easily generate relevant topics in arbitrary numbers without any external help. In an act of openness, unprecedented elsewhere in scientific circles, I'm sharing this secret technology with you here.

    Fresh Topics in Soft Computing
    Generate more topics: Easy, Difficult

    For the curious: here is the source code.

    Tags: , , ,

  • Posted by Konstantin 09.09.2008 3 Comments

    Every time you visit this page, a piece of Javascript code will run within your browser, render a small part of the picture below (which is, for the sake of beauty and simplicity, a fragment of the Mandelbrot fractal) and submit the resulting pixels to the server. After 100 visits the whole picture will be complete (and the rendering restarts). If I hadn't told you that, you wouldn't have the slightest chance of noticing how this page steals your CPU cycles, and that is why one might refer to such practice as parasitic or leech computing.

    Mandelbrot fractal

    The Mandelbrot fractal

    In this simple example, I am probably not winning much by outsourcing the rendering procedure. The computation of each pixel requires about 800 arithmetic operations on average, and this is comparable to the overhead imposed by the need to communicate the results back to the server via HTTP. However, if I chose to render somewhat larger chunks of the image at higher precision, the gains would be much more significant. Additionally, the script could be written so that it would keep running continuously for as long as you are staying at the page, thus sacrificing the user experience somewhat, yet blatantly robbing you of CPU power.

    It seems that this approach to distributed computing has not reached the masses yet. I believe, however, that we are going to see the spread of such parasitic code someday, because it is the second easiest way to monetize website traffic. Indeed, we are already used to watching ads in return for free service. Moreover, quite a lot of the ads are rather heavy Flash applications that spend your CPU cycles with the sole purpose of annoying you. Now, if someone replaced that annoying Flashing banner with a script, that computed something useful behind the scenes, you wouldn't be too disappointed, would you? And that someone could then sell his website traffic not in terms of "banner displays", but in terms of "CPU seconds". Or, well, he could sell both.

    Of course, not every distributed computation can be easily implemented within such an environment. Firstly, it should be possible to divide the problem into a large number of independent parts: this is precisely the case when you need to compute the values of a certain function f for a large number of parameters. The Mandelbrot example above fits this description. Here is one other similar problem. Less obviously, various other tasks could be fit within the framework with the help of the Map-Reduce trick.

    Secondly, the computation of each value f(x) should be reasonably complex, preferably superlinear, i.e. Ω(n^2) or worse. Otherwise, the overhead of sending the inputs (which is O(n)) would offset the benefits too much.

    Thirdly, the description of the function f should be reasonably compact, otherwise the overhead of transferring it to each visitor would be too costly. Note, however, that this issue slightly depends on the kind of traffic being leeched upon: if a website has a small number of dedicated users, each user would only need to download the function definition once and refer to the cached version on his subsequent visits to the site.

    Finally, the function f, as well as its inputs and outputs must be public. This restriction severely limits the use of the approach. For example, although numerous data analysis tasks could satisfy the above conditions, in many practical contexts the data is private and it is thus not possible to openly distribute it to arbitrary visitors of an arbitrary website.

    Besides the theoretical difficulties, there are some technical issues that need to be solved before the whole thing can work, such as the security aspects (you can't trust the results!), implementation (Linear Algebra libraries for Javascript or Flash, please?), ethical concerns and some more.

    Nonetheless, the whole thing still looks rather promising to me, and is at least as worthy of academic and industrial attention, as are all of these overhyped Grid, P2P and SOA technologies around.

    PS: By the way, I find the topic well-suitable for a proper student project/thesis.


    Tags: , , ,