• Posted by Konstantin 25.02.2013 9 Comments

    Most of bioinformatics revolves, in one way or another, around the genome. Even in the largely "non-genomic" areas, such as systems biologyproteomics, or metabolomics, the key players are still genes, proteins, and their regulatory regions, which can be associated with particular points on the genome. Consequently, no matter what kind of data you work with, if you do bioinformatics, you will sooner or later have to deal with genomic coordinates.

    To interpret genomic coordinates you need to know the reference genome version and coordinate conventions used. Does the data file mention those?

    To interpret genomic coordinates you need to know the reference genome version and coordinate conventions used. Does the data file mention those?

    Surprisingly, despite being of such central importance to bioinformatics, the whole genomic coordinate business seems to be in a rather unfriendly state nowadays. Firstly, there are several ways to refer to genomic positions (e.g. 0-based vs 1-based indexing), and for every possible combination of conventions, there is at least one file format that will be using it. Then, of course, you have to deal with several versions of the reference genome, and, to make your life harder yet, most data files will not tell you what genome version should be used to interpret the coordinates stored there. Finally, if you decide that you need to unify the coordinates among your different data files by converting them to the same reference genome version, you will find out that your only tools here are a couple of heavyweight web apps and a command-line UCSC liftOver utility. Should you look for R or Python libraries to script your task, you will discover that those do no smarter than forward all the conversion tasks to that same liftOver.

    I found this is all to be extremely wrong and hacked up a tiny Python tool recently, which will happily convert your coordinates without the need to invoke an external liftOver process. It does not fully replace liftOver (yet?), as it does not convert regions - a task just a bit more tricky than lifting over single points. However it lets you do single-point conversion in the simplest way possible:

    from pyliftover import LiftOver
    lo = LiftOver('hg17', 'hg18')
    lo.convert_coordinate('chr1', 1000000, '-') # 0-based indexing

    As usual, install via: easy_install pyliftover (or pip install pyliftover)

    For more information consult the PyPI page.

    Tags: , , , ,

  • Posted by Konstantin 25.02.2013 No Comments

    If anyone tells you he or she understands probability theory, do not believe them. That person simply does not know enough of it to admit, that probability theory is riddled with paradoxes, where common sense must step aside and wait in silence, or your brain will hurt. Substring statistics is probably among the lesser-known, yet magically unintuitive examples.

    Consider a sequence of random coin flips. Each coin flip is either a "heads" or a "tails", hence the sequence might written down as a sequence of H and T-s: HTHTHHTT...

    It is easy to show that the probability of the sequence to begin with, say, HHH is equal to P(HHH) = 1/8th, as is the case with any other three-letter combination: P(HHT) = P(THH) = P(THT) = 1/8, etc. Moreover, by symmetry, the probability of seeing a particular three-letter combination at any fixed position in the sequence is still always 1/8-th. All three-letter substrings seem to be equivalent here.

    But let us now play a game, where we throw a coin until we see a particular three-letter combination. To be more specific, let us wait until either HHT or HHH comes up. Suppose I win in the first case and you win in the second one. Obviously, the game first proceeds until two heads are flipped. Then, whichever coin flip comes up next determines the winner. Sounds pretty fair, doesn't it? Well, it turns out that, surprisingly, if you count carefully the expected number of coin flips to obtain HHT, it happens to be 8, whereas for HHH it is 14! Ha! Does it mean I have an advantage? Suprisingly again, no. The probability of HHT occuring before HHH in any given sequence is still precisely 0.5 and, as we reasoned initially, the game is still fair.

    We can, however, construct even more curious situations with four-letter combinations. Suppose I bet on HTHT and you bet on THTT.  The expected number of coin flips to obtain my combination can be computed to be 20. The expected number of flips to get your combination is smaller: 18 flips. However, it is still more probable (64%) that my combination will happen before yours!

    If this is not amusing enough, suppose that four of us are playing such a game. Player A bets on the string THH, Player B bets on HHT, player C on HTT and player D on TTH. It turns out that A's combination will occur earlier than B's with probability 75%. B's combination, however, wins over C's with probability 66.7%. C's combination, though, wins over D's with probability 75%. And, to close the loop, D wins over A with probability 66.7%! This is just like the nontransitive dice.

    Hopefully, you are amazed enough at this point to require an explanation for how this all might happen. Let me leave it to you as a small puzzle:

    • Explain in simple terms, how can it happen so that the expected time to first occurrence of otherwise equiprobable substrings may be different?
    • Explain in simple terms, how can it be so that one substring has higher than 50% chance of occuring earlier than some other substring.
    • Finally, explain why the two effects above are not strictly related to each other.

    PS: The theory used to compute actual probabilities and expected times to occurrence of a substring is elegant yet somewhat involved. For the practically-minded, here is the code to check the calculations.

    Tags: , , , ,

  • Posted by Konstantin 27.01.2013 7 Comments

    Most results that are published in mathematics and natural sciences are highly technical and obscure to anyone outside the particular area of research. Consequently, most scientific publications and discoveries do not get any media attention at all. This is a problem both for the public (which would benefit from knowing a bit more about our world), the science in general (which would benefit from wider dissemination) and the scientists themselves (which would certainly appreciate if their work reached more than a couple of other people). The issue is usually addressed by the researchers trying to popularize their findings — provide simple interpretations, which could be grasped by the layman without the need to understand the foundations. Unfortunately, if the researcher was lucky to grab enough media attention, chances are high the process of "popularization" will get completely out of hands, and the message received by the public will have nothing to do with the original finding.

    There are some theorems in pure mathematics, which happened to suffer especially seriously from this phenomenon. My two most favourite examples are the Heizenberg's uncertainty principle and Gödel's incompleteness theorems. Every once in a while I stumble on pieces, written by people who have zero knowledge of basic physics (not even mentioning quantum mechanics or Fourier theory), but claim to have clearly understood the meaning and the deep implications of the uncertainty principle upon our daily lives. Even more popular are Gödel's theorems. "Science proves that some things in this world can never be understood or predicted by us, mere humans!!!" is a typical take on Gödel by the press. Oh, and it is loved by religion enthusiasts!

    This post is my desperate attempt to bring some sanity back into this world by providing a (yet another, but maybe slightly different) popular explanation for Gödel's ideas.

    Gödel's theorems explained (with enough context)

    Kurt Gödel

    Kurt Gödel

    In our daily lives we primarily use symbols to communicate and describe the world. Those may be formulas in mathematics or simply sentences in the English language. Symbol-based systems can be used in different ways. From the perspective of arts and humanities, one is welcome to construct arbitrary sequences of words and sentences, as long as the result is "beautiful", "inspiring" or "seems smart and convincing". From a more technically-minded point of view, however, one is only welcome to operate with "true and logical" statements. However, it is not at all obvious which statements should be universally considered "true and logical". There are two ways the problem can be resolved.

    Firstly, we can determine the truth by consulting "reality". For example, the phrase "All people are mortal, hence Socrates is mortal" is true because, indeed (avoiding a lecture-worth of formalities or so), in all possible universes where there are people and they are mortal, Socrates will always also be mortal.

    Secondly, we can simply postulate a set of statements, which we shall universally regard as "the true ones". To distinguish those postulated truths from the "actual truths", mentioned in the paragraph above, let us call them "logically correct statements". That is, we can hypothetically write down an (infinite) list of all the "logically correct" sentences in some hypothetical "Book of All Logically Correct Statements". From that time on, every claim not in the book will be deemed "illogical" and hence "false" (the question of whether it is false in reality would, of course, depend on the goodness and relevance of the book we created).

    This is really convenient, because now in order to check the correctness of the claim about Socrates we do not have to actually visit all the possible universes. It suffices to look it up in our book! If the book is any good, it will provide good answers, so the concept of "logical correctness" may be close or even equivalent to "actual truth". And in principle, there must exist "The Actual Book of Truth", which would list precisely the "actually true" statements.

    Unfortunately, infinite books are somewhat inconvenient to print and carry around. Luckily, we can try to represent an infinite book in a finite way using algorithms. We have all seen how a short algorithm is capable of producing an infinite amount of nonsense, haven't we? Thus, instead of looking for an (infinitely-sized) "book of truth", we should look for a (finitely-sized) "algorithm of truth", which will be either capable of generating the whole book, or checking for any given statement, whether it belongs to the book.

    Frege's propositional calculus

    Frege's propositional calculus

    For clarity and historical reasons,  the algorithms for describing "books of truths" are usually developed and written down using a particular "programming language", which consists of "axioms" and "inference rules". Here is one of the simplest examples of how a "program" might look like.

    This is where a natural question arises: even if we assume that we have access to "the actual book of truth", will it really be possible to compress it down to a finite algorithm? Isn't it too much to ask? It turns out it is. There is really no way to create a compact representation for any but the most trivial "books of truths".

    Besides the "asking too much" intuition, there are at least two other simple reasons why this is impossible. Firstly, most of the readers here know that there exist problems, that are in principle uncomputable. Those are usually about statements, the correctness of which cannot be checked in finite time by a finite algorithm, with the most famous example being the halting problem, as well as everything related to uncomputable numbers.

    Naturally, if we can't even use a finite algorithm to list "all truly halting programs", our hopes for getting a finite description for any more complicated "book of truths" is gone. But there is another funny reason. Once we have decided to define the book with all true statements and devise an algorithm for generating it, we must not forget to include into the book some statements about the book and the algorithm themselves. In particular, we must consider the following phrase: "This sentence will not be included in the book generated by our algorithm."

    If our algorithm does include this sentence in the generated book, the claim turns out to be false. As a result, our precious book would have false statements in it: it would be inconsistent. On the other hand, if our algorithm produces a book which does not include the above sentence, the sentence turns out to be true and the book is incomplete. It is just the liar's paradox.

    And so it is — we have to put up with the situation, where it is impossible to produce a finite representation for all true statements without stumbling into logical paradoxes. Or, alternatively, that there are mathematical statements, which cannot be checked or proven within a finite time.

    This describes what is known as "Gödel's first incompleteness theorem" (namely, the claim that in most cases our algorithm is only capable of producing either an incomplete or an inconsistent "book"). A curious corollary may be derived from it, which is known as the "Gödel's second incompleteness theorem". The theorem says that if our "book-generating algorithm" happens to include into it exactly the phrase "This book is consistent", it must necessarily be a false claim, and the algorithm must actually be inconsistent. This is often interpreted that no "honest" theory is capable of claiming it's own correctness (there are caveats, though).

    Gödel's theorems have several interesting implications for the foundations of mathematics. None the less, those are still theorems about the fundamental impossibility of using a finite algorithm for generating a book of logically correct statements without stumbling into logical paradoxes and infinite loops. Nothing more and nothing less. They have nothing to do with the experimental sciences: note how we had to cut away all connections to reality in the very first paragraphs of the explanation. And thus, Gödel's theorems are not related to the causes of "human inability to grasp the universe", "failure or success of startup business plans", or anything else of that kind.
    Tags: , , , , , ,

  • Posted by Konstantin 12.11.2012 No Comments

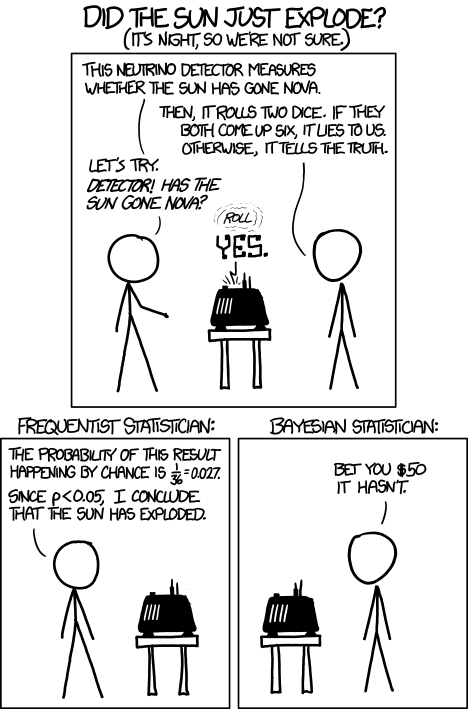
    This relates nicely to several previous posts here.

    Frequentists vs Bayesians

    Copyright © xkcd.

    Tags: , , , ,

  • Posted by Konstantin 26.10.2012 4 Comments

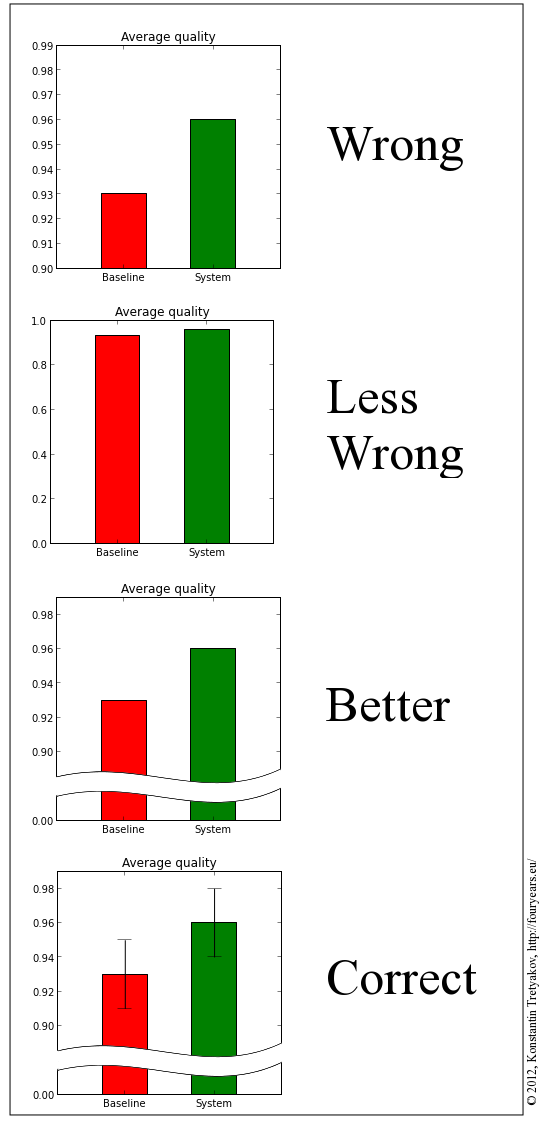
    It is annoying how popular it is to ignore the Y-axis limits on bar charts nowadays. Unfortunately, this is also the default mode for most plotting packages, so no one wants to do anything about it. But something must be done.

    Barplots

    Tags: , ,

  • Posted by Konstantin 13.10.2012 38 Comments

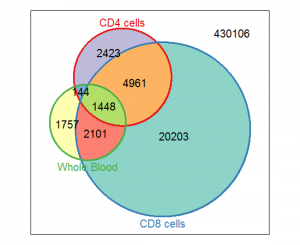
    I have recently discovered that simple Venn diagrams are surprisingly popular in bioinformatics. So popular they are, in fact, that there are several bioinformatics research papers devoted solely to their use. And those are highly accessed papers, let me add! Yet, despite this wild popularity, tools that let you render a decent Venn diagram programmatically seem to be rather scarce.

    Vennerable plot

    Vennerable plot

    If you google a bit, you will find a bunch of on-line tools of varying degrees of quality and ability (1, 2, 3, 4, 5, 6, 7, 8, 9,...), a Java-based tool,  a Perl library, a couple of Python scripts (1, 2), some R libraries (1, 2, 3, 4, 5), and lots of forum discussions. Seems to be plenty, doesn't it? Well, it turns out that if you want your diagram to be area-weighted (i.e. the regions of the diagram should be roughly proportional to the corresponding set sizes), 4 of those 18 links won't do. If you want to generate and configure the diagram conveniently from a script, drop another 9. Then, if you want the diagram to look nice, drop 4 more, and all you are left with is the Vennerable R package. Unfortunately, Vennerable plots are still a pain to configure — even adding a plot title seems to be very tricky, not speaking of highlighting and annotating a region on the diagram.

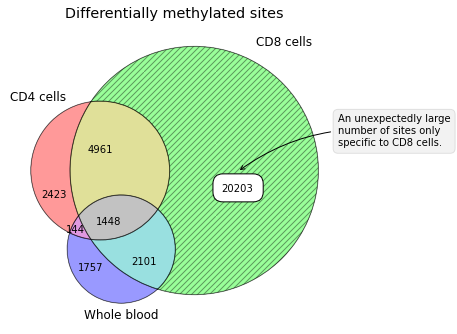
    Having been totally disappointed in the state of the art of contemporary Venn-diagramming tools, I made a small Python package for drawing Venn diagrams that has the necessary flexibility. At least it lets me put plot titles and annotate diagram regions as I fancy.


    Matplotlib-venn plot

    Matplotlib-venn plot


    Package installation goes by the standard method: easy_install matplotlib-venn

    For basic usage examples, consult the PyPI page.

    Tags: , , , ,

  • Posted by Konstantin 26.09.2012 4 Comments

    The issues related to scientific publishing, peer-review and funding always make for popular discussion topics at conferences. In fact, the ongoing ECML PKDD 2012 had a whole workshop, where researchers could complain about discuss some of their otherwise interesting results that were hard or impossible to publish. The rejection reasons ranged from "a negative result" or "too small to be worthy of publication" to "lack of theoretical justification". The overall consensus seemed to be that this is indeed a problem, at least in the field of machine learning.

    The gist of the problem is the following. Machine learning relies a lot on computational experiments - empirically measuring the performance of methods in various contexts. The current mainstream methodology suggests that such experiments should primarily play a supportive role, either demonstrating a general theoretic statement, or simply measuring the exact magnitude of the otherwise obvious benefit. This, unfortunately, leaves no room for "unexpected" experimental results, where the measured behaviour of a method is either contradicting or at least not explained by the available theory. Including such results in papers is very difficult, if not impossible, as they get criticised heavily by the reviewers. A reviewer expects all results in the paper to make sense. If anything is strange, it should either be explained or would better be disregarded as a mistake. This is a natural part of the quality assurance process in science as a whole.

    Quite often, though, unexpected results in computational experiments do happen. They typically have little relevance to the main topic of the paper, and the burden of explaining them can be just too large for a researcher to pursue. It is way easier to either drop the corresponding measurement, or find a dataset that behaves "nicely". As a result, a lot of  relevant information about such cases never sees the light of day. Thus, again and again, other researchers would continue stumbling on similar unexpected results, but continue shelving them away.

    The problem would not be present if the researchers cared to, say, write up such results as blog posts or tech-reports in ArXiv, thus making the knowledge available. However, even formulating the unexpected discoveries in writing, let along go any deeper, is often regarded as a waste of time that won't get the researcher much (if any) credit. Indeed, due to how the scientific funding works nowadays, the only kind of credit that counts for a scientist is (co-)authoring a publication in a "good" journal or conference.

    I believe that with time, science will evolve to naturally accommodate such smaller pieces of research into its process (mini-, micro-, nano-publications?), providing the necessary incentives for the researchers to expose, rather than shelve their "unexpected" results. Meanwhile, though, other methods could be employed, and one of the ideas that I find interesting is the concept I'd call "co-authorship licensing".

    Instead of ignoring a "small", "insignificant", or an "unexpected" result, the researcher should consider publishing it as either a blog post or a short (yet properly written) tech report. He should then add an explicit requirement, that the material may be referred to, cited, or used as-is in a "proper" publication (a journal or a conference paper) with the condition that the author of the post must be included in the author's list of the paper.

    I feel there could be multiple benefits to such an approach. Firstly, it non-invasively addresses the drawbacks of the current science funding model. If being cited as a co-author is the only real credit that counts in the scientific world, why not use it explicitly and thus allow to effectively "trade" smaller pieces of research. Secondly, it enables a meaningful separation of work. "Doing research" and "publishing papers" are two very different types of activities. Some scientists, who are good at producing interesting experimental results or observations, can be completely helpless when it comes to the task of getting their results published. On the other hand, those, who are extremely talented in presenting and organizing results into high-quality papers, may often prefer the actual experimentation to be done by someone else. Currently, the two activities have to be performed by the same person or, at best, by the people working at the same lab. Otherwise, if the obtained results are not immediately "properly" published, there is no incentive for the researchers to expose them. "Co-authorship licensing" could provide this incentive, acting as an open call for collaboration at the same time. (In fact, the somewhat ugly "licensing" term could be replaced with a friendlier equivalent, such as "open collaboration invitation", for example. I do feel, though, that it is more important to stress that others are allowed to collaborate rather than that someone is invited to).

    I'll conclude with three hypothetical examples.

    • A Bachelor's student makes a nice empirical study of System X in his thesis, but has no idea how to turn this to a journal article. He publishes his work in ArXiv under "co-authorship license", where it is found by a PhD student working in this area, who was lacking exactly those results for his next paper.
    • A data miner at company X, as a side-effect of his work, ends up with a large-scale evaluation of learning algorithm Y on an interesting dataset. He puts those results up as a "co-authorship licensed" report. It is discovered by a researcher, who is preparing a review paper about algorithm Y and is happy to include such results.
    • A bioinformatician discovers unexpected behaviour of algorithm X on a particular dataset. He writes his findings up as a blog post with a "co-authorship license", where those are discovered by a machine learning researcher, who is capable of explaining the results, putting them in context, and turning into an interesting paper.

    It seems to me that without the use of "co-authorship licensing" the situations above would end in no productive results, as they do nowadays.

    Of course, this all will only make sense once many people give it a thought. Unfortunately, no one reads this blog 🙂

    Tags: ,

  • Posted by Konstantin 03.09.2012 2 Comments

    For many people, the ability for learning and adaptation seems like something unique, extremely complicated and mysterious. Indeed, those are the abilities we almost exclusively associate with high levels of intelligence and knowledge. This is, however, an illusion. Although adaptive behaviour might indeed look complex, it is not necessarily driven by "intelligent" mechanisms. One of the best illustrations of this is a fully-fledged self-learning machine made from plain matchboxes.

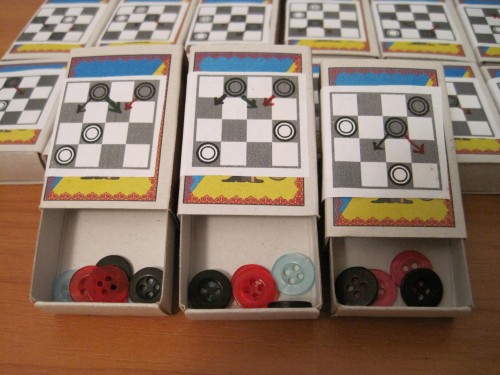
    A Tic-Tac-Toe machine made by James Bridle

    A Tic-Tac-Toe machine by James Bridle

    The idea for such a machine was first introduced in 1960 by Donald Michie, who devised a simple self-learning algorithm for Tic-Tac-Toe (reminiscent of what is now known to be Reinforcement Learning). Due to lack of appropriate computing power, he implemented it "in hardware" using 300 or so matchboxes.

    The idea of the machine is simple. There is a matchbox corresponding to each game position, where the "computer" has to make a move. The matchbox contains colored beads, each color corresponding to a particular move. The decision is made by picking a random bead from the matchbox. Initially (when the machine is "untrained"), there is an equal number of beads of each color, and the machine thus makes equiprobably random turns. After each game, however, the machine is "punished" by removing beads, corresponding to losing turns, or "rewarded" by adding beads, corresponding to winning turns. Thus, after several games, the machine will adapt its strategy towards a winning one.

    The idea was popularized by Martin Gardner in one of his Scientific American articles (later published in the book "The Unexpected Hanging and Other Mathematical Diversions"). Gardner invented a simple game of  "Hexapawn", and derived a matchbox machine for it, which only required as little as 19 matchboxes. He also suggests in his article, however, to create a matchbox machine for "Mini-checkers" - checkers played on a 4x4 board. Ever since I saw this article some 20 or so years ago I was thinking of making one. This summer, while teaching a machine learning course in a summer school in Kiev, I actually made one. I could use it to both fulfil my ages-old desire as well as a teaching aid. You can make one too now, if you are interested.

    The Mini-checkers Machine

    The rules of mini-checkers are exactly like those of usual checkers, with three modifications:

    • The game is played on a 4x4 field. White is the first one to move. Machine plays for black.
    • Whenever both players get a King, the game immediately ends in a draw.
    • The King must always move to the furthest possible position in the chosen direction.

    To make the machine, you first have to buy and empty 24 matchboxes. Next, print out and stick the 24 game positions onto the boxes. Draw on each box all the possible black's moves as arrows using colored markers. Finally, for  each colored arrow, add 2 beads of the same color into the matchbox. That's it, your machine is ready to play.

    The Mini-checkers machine

    The Mini-checkers machine

    The game proceeds as already described: whenever the machine (the black player) has to make a decision (i.e. whenever it has to make a move and there is more than one possibility), find the matchbox with the current position depicted on it, shake it, and pick a random bead. This will tell you the decision of the machine. If the corresponding matchbox is empty, the machine forfeits. You should keep the matchboxes, corresponding to the moves that were made, open until the end of the game.

    Once the game is over, the machine is "taught":

    • If the machine won, do nothing.
    • If the game was a draw, remove the bead corresponding to the machine's last move from the matchbox, unless it was the last bead of that color in the box.
    • If the machine lost, remove all the beads, corresponding to the machine's last move, from the last matchbox.

    It takes about 30 games or so for the machine to actually learn to play well enough. Of course, a human would understand the strategy much earlier, but it's fun none the less.

    Playing with the machine will immediately lead you towards two important questions:

    • How efficient is the suggested learning procedure? Can it be improved and generalized?
    • How do you make a matchbox machine for a more complex game without having to manage thousands of matchboxes.

    As far as I know, contemporary machine learning has only partial answers to both of them.

    Tags: , , , ,

  • Posted by Konstantin 07.06.2012 33 Comments

    The following text will only make sense to you if you know the technical details of Support Vector Machine learning.

    Having recently had to give some lectures (1,2,3,4) and exercise sessions (1,2,3,4) on linear classification in a machine learning course, I discovered that one of the most famous linear classification methods, the classical Support Vector Machine, does not seem to be fully specified in any of the prominent reference materials. Namely, the SVM learning procedure produces two parameters: the coefficient vector \bf\alpha and the bias term b. While the problem of finding \bf\alpha is typically explained in sufficient detail, the procedure of computing b is usually swept under the carpet.

    Here is, for example, what we see in the Vapnik's seminal work, the birthplace of SVMs (Section 10.2, page 411):

    Vapnik (page 411)According to my calculations this is plain incorrect, because the corresponding Kuhn-Tucker conditions (in the "soft margin" SVM that we are considering here) are actually:

        \[\alpha_t^0\left(\frac{1}{\gamma}\sum_{i=1}^\ell \alpha_i^0y_i(x_t * x_i) + b-1+\xi_i\right) = 0\]

    The important difference is the presence of the \xi_i term, which is unknown, hence the equation is not useful for finding b. Later on, the reader is also presented with the following summarizing description of the algorithm:

    Vapnik (page 425)Do you see any mention of the way to compute b? I would expect the author to be somewhat more helpful with respect to this detail, which is obviously important for anyone willing to implement their own version of SVM.

    OK, that was an old book, let's take a look at some newer materials. The two books which could be regarded as authoritative sources on the subject of SVMs are probably "An Introduction to Support Vector Machines" and "Kernel Methods for Pattern Analysis". Here is what the first book tells us about computing b (Proposition 6.11, page 106):

    Cristianini (page 106)

    This suggests that in order to compute b we need to find \alpha_i^*, such that C>\alpha_i^*>0, i.e. there must exist at least one training point lying exactly on the margin. Although in most practical situations such support vectors will indeed exist, it is also theoretically possible that there won't be any, i.e. not a single support vector will lie exactly on the margin. Thus, for purposes of implementing SVMs, the provided specification is incomplete.

    The same problem is present in the second book:

    Shawe-Taylor

    Take a careful look at lines 5-6, which claim that in order to compute b we need to choose i,j such that the corresponding \alpha_i, \alpha_j are strictly between 0 and C. This is not necessarily true for any \alpha_i.

    So then, what is the proper, fully general way of computing b? Of course, it is not too hard to derive, and thus makes for a great course homework exercise (e.g. Exercise 4 here). If you managed to read up to this point, I presume you should be motivated enough to try solving it. If you give up, you are welcome to consult my sample solution (Exercise 4, page 7).

    Tags: , , ,

  • Posted by Konstantin 30.05.2012 No Comments
    Sportloto lottery ticket

    Sportloto lottery ticket

    Consider the following hypothetical lottery scheme. A player pays a dollar for a lottery ticket. On the ticket he has to mark a number between 1 and 100. When sufficient number of tickets was sold, the single "lucky number" is drawn randomly using a lotto machine, and half of the proceeds from ticket sales are shared equally among all tickets that bet on that number. The other half goes to charity.

    Now, given the whole "charity" deal, the amount of money going into the lottery is greater than the amount of money paid back, hence the game is obviously disadvantageous for the players. The expected returns of an average ticket are just $0.5, hence "the house always wins", and "lottery is a tax on people who do not understand probability theory", as they say. Right? It turns out things are not that simple.

    Suppose there are 100 000 people in the country who play this lottery, each one buying a single ticket. Let us imagine that, for some reason, everyone who plays the lottery is extremely superstitious and will never bet on the number 13 because it is universally despised as unlucky. Knowing that, let us now go and buy a single ticket, betting on 13. Behold: we have just paid one dollar for a 1% chance to win 50 000 dollars! Indeed, there is a 1% chance the lottery machine will draw 13 as the winning number and if this happens we will be the only candidate for receiving the whole winning fund - $50 000 in our case. Consequently, the expected returns for our ticket are $50 000 x 0.01 = $500, and the bet is well worth its price.

    In general, it is easy to show that betting on any number which is sufficiently unpopular, namely any number which less than 500 of the 100 000 participants will decide to bet on, results in positive expected returns (note that on average we expect about 1000 people to bet on a "random" number).

    To highlight the concept a bit more, let us consider an even better hypothetical possibility. Let us say that all of the 100 000 lottery players decide to bet on their birth dates. This means that their bets would cover only the numbers between 1 and 31. The smart idea then would be to buy 69 tickets, betting on each of the remaining numbers (32..100). Such a bet costs $69 and wins the sum of $50 034 with probability 69%. The expected returns per each dollar invested are still around $500, but in addition you win with astonishing certainty.

    Does this have anything to do with reality? It turns out it does. This article from 1980 (in Russian) studies the popular Soviet lottery "Sportloto", in which the players had to select 5 or 6 numbers from a grid of 36 or 45 numbers respectively (see illustration above). The drawing was performed, and the players who managed to guess enough numbers would share a portion of the lottery fund. Note that this is just a more elaborate variation of the "pick one out of 100" lottery above. And of course, psychological aspects play a large role in biasing players' number selections. People tend to prefer numbers towards the bottom of the grid to those on the first lines. People prefer smaller numbers to larger ones. And, most importantly, people tend to avoid picking regular patterns (e.g. all numbers in a sequence, or those forming a nice rectangle), as such combinations intuitively seem to be "too improbable to happen".

    This results in a situation where betting on a "psychologically improbable" pattern of numbers may turn out to be profitable in terms of expected returns. The authors of the mentioned article actually used historical lottery drawing data to estimate the returns they would have if they would constantly participate in Sportloto using such patterns, and reported the ratio of winnings to spending of around 1.15 to 1.39.

    This is not meant to encourage you to gamble (moreover, most lotteries do not work this way), but if you have to, do not underestimate the luckiness of the unlucky numbers.

    Tags: , , ,